![]()
Initial PV System Performance
The photovoltaic (PV) solar electric generation system is grid-interactive, producing DC power which is inverted into AC current and then fed directly into the local utility feeder of Lakeland Electric and Water Company. During the first week in which thermal conditions were monitored in the two homes, the initial PV system performance was tracked. The PV system had been in operation for about 10 days when monitoring began.
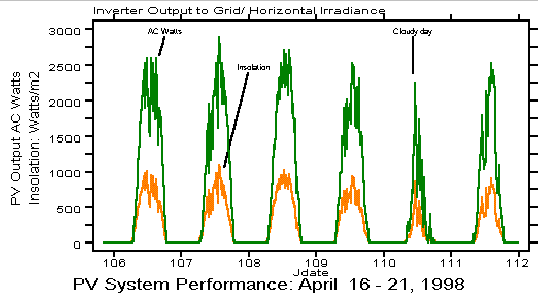
The first figure below shows the AC power (watts) sent to the grid by the PV system over several days in April, 1998. Sky conditions over the period varied from sunny to cloudy with rain. Over this period, the average daily net power to the grid was 15.2 kWh with a peak 15-minute power production of 3.0 kW. On average, the daily PV output peaked at 1:45 PM EST.
Since installation, performance of the PV system has been as expected. One observation from review of the data is that the maximum produced power (3.0 kW) is less than the nominal 4.05 kW of the installed system. This is due to a number of factors-- all expected. The first reason is that the nameplate value (75 W) of each of the 54 modules output is slightly optimistic relative to what will be seen in a typical field installation. In actuality, mismatch losses, wiring losses and even array surface soiling will see the actual power production about 5% less than the nameplate rating.

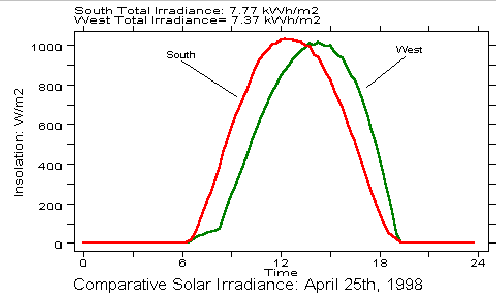
Thirdly, approximately 1.35 kW of the 4 nominal kW installed faces west. We intentionally installed with this segment to explore how this would assist in meeting late afternoon peak electrical needs for the home. Regardless, its peak power production is somewhat out of phase with that of the larger south facing array (the reason why the observed system peak output is at 1:45 PM rather than solar noon). When the south system is seeing an insolation level of 1000 W/m2, the west portion will be seeing less and thus produces less total peak power. The ratio on the two orientations will change seasonally, but the insolation from the west array averaged 880 W/m2 when the south array was receiving 1000 W/m2. Of course the west array is of advantage in the later afternoon; for example, at 6 PM EST when many homeowners are coming home and turning on appliances, the insolation on array tilt averaged only 133 W/m2 on the south array while it was 354 W/m2 on the west array. This advantage is illustrated graphically in the recorded solar irradiance data from a clear day on April 25th. The plot shows that although the total daily irradiance on the west facing array was about 5% less than that on the south, together the south and west array segments help to broaden the potential power production throughout the later afternoon hours.
Finally, there are losses in the inverter conversion efficiency from DC to AC current. Since we measure the array current and voltage output to the inverter and were able to estimate this conversion efficiency over the initial monitoring period to average approximately 89%.
All of the above factors work together bring the expected peak power production down to approximately 3 kW. This understood, the initial performance of the PV system has fully met expectations, producing AC power dependably for the utility without incident. Further, with the efficiency of the PVRES building, we should have enough power produced to meet most of the daytime net energy needs of the home.


