
Reference Publication: Fairey, P., "Potential of Energy Efficiency and Renewable Energy Savings To Impact Florida's Projected Energy Use in 2014, " Research Report No. FSEC-RR-58-06, Florida Solar Energy Center, Cocoa, FL, January, 2006. Disclaimer: The views and opinions expressed in this article are solely those of the authors and are not intended to represent the views and opinions of the Florida Solar Energy Center. |
Potential of Energy Efficiency and Renewable Energy Savings
To Impact Florida's Projected Energy Use in 2014
Philip
Fairey
Florida
Solar Energy Center (FSEC)
FSEC-RR-58-06
Introduction
Florida’s 2004 electrical energy use was 233
billion kilowatt-hours. Over half (51%) of this energy use
went to residential building energy. The state’s current
10-year predictions for electrical energy use in 2014 show a requirement
for approximately 308 billion kilowatt-hours of electricity, an
increase of approximately 75 billion kilowatt-hours. This
study presents an example of how Florida can radically alter its
2014 energy use projection by aggressively pursuing residential
building energy efficiency improvements and aggressively increasing
its use of proven renewable energy resources.
Methods
This study was conducted using EnergyGauge® USA (v.2.52), a detailed, hourly, building energy simulation software based on the U.S. Department of Energy’s DOE-2.1E (v.120) simulation engine. EnergyGauge was developed by the Florida Solar Energy Center and has been nationally accredited by the Residential Energy Services Network (RESNET) for use as a home energy rating software tool.1
Three typical Florida homes, each with 2000 square feet of conditioned floor area and three bedrooms have been evaluated using EnergyGauge to determine the degree to which they could be improved through off-the-shelf energy efficiency and renewable energy technology. Each home is improved to the point that it will qualify for the new $2,000 federal tax credit for highly efficient new homes. This tax credit, created by the U.S. Energy Policy Act of 2005, requires that the heating and cooling energy use for qualifying homes be 50% or less of the heating and cooling energy use of a reference home, as defined by the minimum requirements of Section 404 of the 2004 Supplement to the International Energy Efficiency Code (IECC). 2
The three homes were located in Miami, Tampa and Tallahassee in order to represent the variety of Florida climates. Each of the homes was configured in three ways:
-
To represent the current minimum Florida building code standards (2004 baseline home)
-
To represent a home that would qualify for the 2006 IRS tax credit, which also contained a solar hot water heater (EERE home), and
-
The same configuration as number 2 with a 2 kW-peak photovoltaic system added (EERE-PV home).
The results from these simulations were then entered
in an Excel spreadsheet to perform analysis and expand the results
to represent statewide potentials. In addition, the hourly
electric energy demand results for the peak summer and peak winter
days for each climate were also downloaded to the spreadsheet to
examine the impacts on utility load shape.
Results
Results show that significant electrical energy savings in Florida homes are both possible and practical. If the IRS tax credits are augmented by State of Florida rebates, electrical energy savings exceeding 40% of total home energy use are cost-effectively achieved (for the consumer) in all three climates zones.
Summary Results
Results from the individual simulations are broadly extrapolated to the entire state by assuming specific installations per year over the 10 years for each of the various renewable energy and energy efficiency strategies evaluated. The annual installations shown in Table 1 were used to extrapolate the individual results to the statewide totals. It is also important to note that Florida constructs approximately 160,000 new homes each year and has approximately 6.2 million existing homes in place.
Table 1. Assumed Installations
for Aggressive Florida Energy Efficiency and
Renewable Energy Technologies Program
Measures |
Population Base |
Installations |
|---|---|---|
| High-efficiency new homes | 160,000 per year | 24,000 per year |
| Solar hot water (new homes)> | 160,000 per year | 24,000 per year |
| Improved existing home efficiency (15%) | 6,200,000 | 62,000 per year |
| Solar hot water (existing homes) | 6,200,000 | 62,000 per year |
| Photovoltaic systems (2 kWp) | 6,200,000> | 9,300 per year |
Using the above assumptions for installations that Florida could achieve by providing additional incentives to those that are provided by IRS tax credits, the statewide savings of such a program can be estimated as shown in Table 2 with costs as shown in Table 3.
Table 2. Savings in Energy Use, Costs and CO2 for Statewide Program
| Consumer Savings |
New
Plant Savings |
Fuel Saved |
TRECs Created |
Total
$ Saved |
CO2 Saved |
|||
|---|---|---|---|---|---|---|---|---|
(TWh) |
($mil) |
(MW) |
($mil) |
($mil) |
($mil) |
($mil) |
(MTons) |
|
| 10-years | ||||||||
| Efficiency | 14.68 |
$1,468 |
950 |
$950 |
$734 |
n/a |
$3,152 |
21.16 |
| Renewables | 10.52 |
$1,052 |
681 |
$681 |
$526 |
$421 |
$2,681 |
15.17 |
| Total | 25.20 |
$2,520 |
1,631 |
$1,631 |
$1,260 |
$421 |
$5,833 |
36.34 |
| Annual | ||||||||
| Efficiency | 2.67 |
$267 |
173 |
$173 |
$133 |
n/a |
$573> |
3.85 |
| Renewables | 1.91 |
$191 |
124 |
$124 |
$96 |
$77 |
$487 |
2.76 |
| Total | 4.58 |
$458 |
297 |
$297 |
$229 |
$77 |
$1,060 |
6.61 |
Table 3. Apportioned 10-year Costs and Rebates of Example Statewide Program
Individual Components |
Costs |
Market |
IRS |
Florida |
Consumer |
Rebate |
|---|---|---|---|---|---|---|
| ($/unit) | ($mil) | ($mil) | ($mil) | ($mil) | Total (%) | |
| Solar hot water (new)* | $3,200 | $768 | ||||
| Federal tax credits | $960 | $230 | ||||
| Florida Rebate (1) | $590 | $142 | ||||
| Total rebates | $1,550 | $372 | 48.4% | |||
| Net consumer costs | $1,650 | $396 | ||||
| Total units | 240,000 | |||||
| Efficiency - new homes* | $7,000 | $1,680 | ||||
| Federal tax credits | $2,000 | $480 | ||||
| Florida Rebate (1) | $1,453 | $349 | ||||
| Total rebates | $3,453 | $829 | 49.3% | |||
| Net consumer costs | $3,547 | $851 | ||||
| Total units | 240,000 | |||||
| Solar hot water (existing)* | $3,600 | $2,232 | ||||
| Federal tax credits | $1,080 | $670 | ||||
| Florida Rebate (1) | $590 | $366 | ||||
| Total rebates | $1,670 | $1,035 | 46.4% | |||
| Net consumer costs | $1,930 | $1,197 | ||||
| Total units | 620,000 | |||||
| Efficiency - existing homes* | $4,000 | $2,480 | ||||
| Federal tax credits | $500 | $310 | ||||
| Florida Rebate (1) | $729 | $452 | ||||
| Total rebates | $1,229 | $762 | 30.7% | |||
| Net consumer costs | $2,771 | $1,718 | ||||
| Total units | 620,000 | |||||
| Photovoltaic systems* | $14,000 | $1,302 | ||||
| Federal tax credits | $2,000 | $186 | ||||
| Florida Rebate (2) | $5,000 | $465 | ||||
| Total rebates | $7,000 | $651 | 50.0% | |||
| Net consumer costs | $7,000 | $651 | ||||
| Total units | 93,000 | |||||
| Totals: | $8,462 | $1,876 | $1,631 | $4,813 | 41.4% | |
| Table Notes: | ||||||
| (1) Rebate = $0.30 per annual kWh saved | ||||||
| (2) Rebate = $2.50 per peak-watt with minimum installation of 2 kWp | ||||||
| * Typical costs are best available estimates | ||||||
Table 3 above shows a rebate incentive cost to Florida of $1,631 million over 10 years or $163 million per year. However, such a rebate program cannot be carried out for the cost of the rebates alone. Estimated total costs to operate the program are as follows:
Consumer rebate incentives: |
$163.1M | |
|---|---|---|
Marketing costs @ |
7.5% | $12.2M |
Verification & assessment costs @ |
5.0% | $8.2M |
Administration costs @ |
5.0% | $8.2M |
Total Costs: |
$192M |
While this may appear to be a large expenditure, it should be remembered that the electrical savings are quite large at more than 4,580 gigawatt-hours per year and more than $450 million in consumer savings each year. It should also be remembered that implementation of these measures is being highly leveraged by federal tax credits, which are estimated to add an additional $188 million to the total value of the program. There are also additional economic benefits that accrue from keeping almost $230 million per year in fuel costs from leaving the state, creating more than $75 million in Tradable Renewable Energy Credits each year and saving almost 7 million tons of CO2 emissions each year. Based on the market expenditures to achieve these results and a simplified estimate of 15 net new jobs per million in expenditures, this program would also create more than 126,000 jobs over the 10-year period.
It is also important to remember that Florida has authorized other programs for the purpose of saving energy with similar annual costs through the Florida Energy-Efficiency and Conservation Act (FEECA). The Florida Public Services Commission (PSC) reports that statewide utility demand side management (DSM) programs operated under FEECA recovered $240 million in costs and saved 239 gigawatt-hours of electricity in 2004. A comparison of this program with the example presented here, as shown in Table 4 below, is helpful.
Table 4. Comparison of Study Results with Florida’s Current DSM Programs
| Energy Efficiency Program | Annual Costs ($mil) |
Annual Savings (GWh) |
Cost of Saved Energy (at end of 10th year) ($/kWh) |
| 2004 Florida DSM programs | $240 | 239 | $0.1826 |
| Florida EERE study program | $379 | 4,582 | $0.0150 |
| Florida rebate subtotals | $192 | $0.0076 | |
| IRS tax credit subtotals | $188 | $0.0074 |
Detailed Simulation Results
The following pages contain detailed information on the three
EERE prototypes and results considered in this study. All
results are as reported by the EnergyGauge USA home energy rating,
code compliance and building energy simulation software tool:
- The detailed improvements that were considered for each of the three EERE prototypes,
- The calculated energy savings potential for each prototype,
- The Home Energy Rating3 for each prototype, and
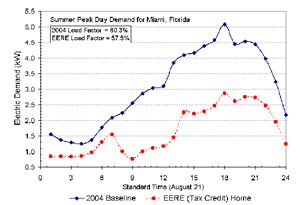
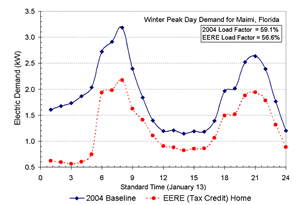
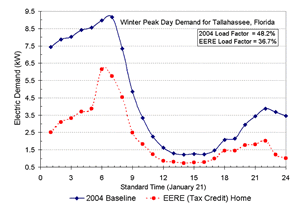
- The peak summer and winter day load shapes for each prototype.
Table 5. Miami EERE-PV Home (off-the-shelf technology)
| Component | Characteristic |
| Windows | Low-e, metal frame, SHGC=0.28 windows |
| Doors | Insulated (R-5) |
| Ceilings | Standard truss; R-30 insulation |
| Walls | Concrete block; R-10 insulation |
| Floors | Slab-on-grade with 50% tile; R-0 insulation |
| Roof | Barrel tile, light colored (solar reflectance = 40%) |
| Attic | Standard vented with radiant barrier system (RBS) |
| Heating and cooling | SEER-15, HSPF-8.2 heat pump |
| Air distribution system | Interior ducts & AHU; leakage <= 0.03 cfm25/ft2 |
| Controls | Programmable thermostat |
| Ventilation | Mechanically controlled to minimize infiltration |
| Lighting | 50% fluorescent (or CFL) lighting |
| Refrigerator | Energy Star qualified |
| Ceiling fans | Energy Star qualified |
| Dishwasher | Energy Star qualified |
| Renewable hot water | Open loop solar hot water (30% tax credit) |
| Renewable power | 2.0 kW-peak photovoltaic system (30% tax credit) |
Table 5.a. EnergyGauge Predicted Energy Use and Savings for Miami Cases
Energy
End Uses |
2004
baseline |
EERE
Home |
kWh/kW
Savings |
%
Savings |
|---|---|---|---|---|
| Cooling | 6,918 | 2,732 | 4,186 | 60.5% |
| Heating | 42 | 8 | 34 | 81.0% |
| Hot water | 2,238 | 322 | 1,916 | 85.6% |
| Ceiling fans | 651 | 329 | 322 | 49.5% |
| Dishwasher | 145 | 115 | 30 | 20.7% |
| Dryer | 891 | 891 | 0 | 0.0% |
| Lighting | 2,055 | 1,522 | 533 | 25.9% |
| Miscellaneous | 2,671 | 2,671 | 0 | 0.0% |
| Range | 447 | 447 | 0 | 0.0% |
| Refrigerator | 775 | 650 | 125 | 16.1% |
| Total kWh | 16,756 | 9,683 | 7,073 | 42.2% |
| Summer peak kW | 5.08 | 2.87 | 2.21 | 43.5% |
| Winter peak kW | 3.18 | 2.17 | 1.01 | 31.7% |
| 2 kWp PV kWh | --- | -2,366 | 9,439 | 56.3% |
| CO2 tons/year | 17.97 | 7.61 | 10.36 | 57.7% |
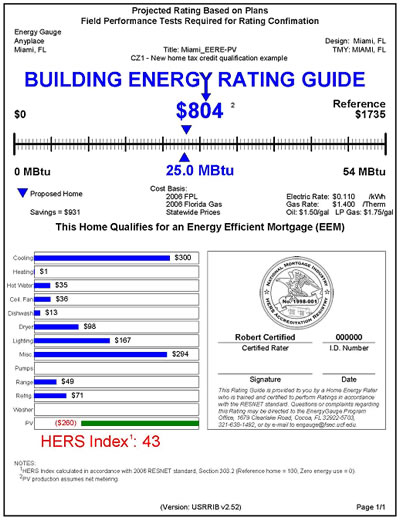
(Click image to see a larger picture.)
Residential Building Energy Efficiency
and
Renewable Energy (EERE) Savings Potential
Miami Peak Day Plots
 |
 |
(Click on graph to
view a larger image.) |
|
Table 6. Tampa EERE-PV Home (off-the-shelf technology)
Component |
Characteristic |
|---|---|
| Windows | Low-e, vinyl frame, SHGC=0.28 windows |
| Doors | Insulated (R-5) |
| Ceilings | Standard truss; R-30 insulation |
| Walls | Concrete block; R-10 insulation |
| Floors | Slab-on-grade with 50% tile; R-0 insulation |
| Roof | Barrel tile, light colored (solar reflectance = 40%) |
| Attic | Standard vented with radiant barrier system (RBS) |
| Heating and cooling | SEER-15, HSPF-8.2 heat pump |
| Air distribution system | Interior ducts & AHU; leakage <= 0.03 cfm25/ft2 |
| Controls | Programmable thermostat |
| Ventilation | Mechanically controlled to minimize infiltration |
| Lighting | 50% fluorescent (or CFL) lighting |
| Refrigerator | Energy Star qualified |
| Ceiling fans | Energy Star qualified |
| Dishwasher | Energy Star qualified |
| Renewable hot water | Open loop solar hot water (30% tax credit) |
| Renewable power | 2.0 kW-peak photovoltaic system (30% tax credit) |
Table 6.a. EnergyGauge Predicted Energy Use and Savings for Tampa Cases
Energy End Uses |
2004 baseline |
EERE Home |
kWh/kW Savings |
% Savings |
|---|---|---|---|---|
| Cooling | 5,052 | 1,877 | 3,175 | 62.8% |
| Heating | 559 | 146 | 413 | 73.9% |
| Hot water | 2,417 | 427 | 1,990 | 82.3% |
| Ceiling fans | 651 | 329 | 322 | 49.5% |
| Dishwasher | 145 | 115 | 30 | 20.7% |
| Dryer | 891 | 891 | 0 | 0.0% |
| Lighting | 2,055 | 1,522 | 533 | 25.9% |
| Miscellaneous | 2,671 | 2,671 | 0 | 0.0% |
| Range | 447 | 447 | 0 | 0.0% |
| Refrigerator | 775 | 650 | 125 | 16.1% |
| Total kWh | 15,663 | 9,075 | 6,588 | 42.1% |
| Summer peak kW | 4.53 | 2.47 | 2.06 | 45.5% |
| Winter peak kW | 4.16 | 2.63 | 1.53 | 36.8% |
| 2 kWp PV kWh | --- | -2,416 | 9,004 | 57.5% |
| CO2 tons/year | 16.47 | 7.04 | 9.43 | 57.3% |
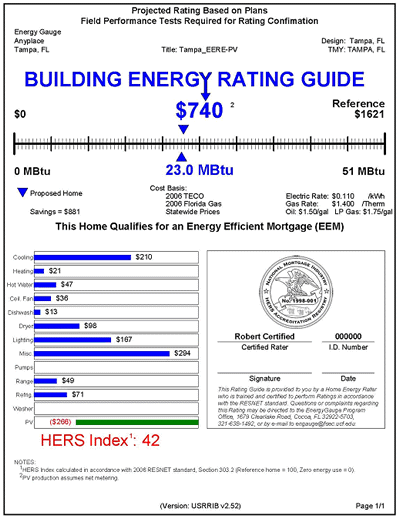
(Click image to see a larger picture.)
Residential Building Energy Efficiency and
Renewable Energy (EERE) Savings Potential
Tampa Peak Day Plots
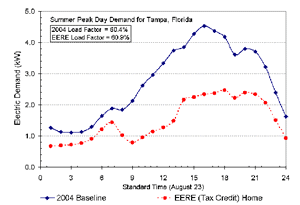 |
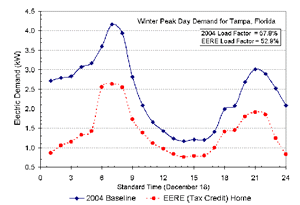 |
(Click on graph to
view a larger image.) |
|
Table 7. Tallahassee EERE-PV Home (off-the-shelf technology)
Component |
Characteristic |
|---|---|
| Windows | Low-e, vinyl frame, SHGC=0.40 windows |
| Doors | Insulated (R-5) |
| Ceilings | Standard truss; R-30 insulation |
| Walls | 2x4 frame; R-13 insulation |
| Floors | Slab-on-grade with 50% tile; R-0 insulation |
| Roof | Barrel tile, light colored (solar reflectance = 40%) |
| Attic | Standard vented with radiant barrier system (RBS) |
| Heating and cooling | SEER-15, HSPF-8.2 heat pump |
| Air distribution system | Interior ducts & AHU; leakage <= 0.03 cfm25/ft2 |
| Controls | Programmable thermostat |
| Ventilation | Mechanically controlled to minimize infiltration |
| Lighting | 50% fluorescent (or CFL) lighting |
| Refrigerator | Energy Star qualified |
| Ceiling fans | Energy Star qualified |
| Dishwasher | Energy Star qualified |
| Renewable hot water | Open loop solar hot water (30% tax credit) |
| Renewable power | 2.0 kW-peak photovoltaic system (30% tax credit) |
Table 7.a. EnergyGauge Predicted Energy Use and Savings for Tallahassee Cases
Energy End Uses |
2004 baseline |
EERE Home |
kWh/kW Savings |
% Savings |
|---|---|---|---|---|
| Cooling | 3,523 | 1,389 | 2,134 | 60.6% |
| Heating | 2,282 | 728 | 1,554 | 68.1% |
| Hot water | 2,663 | 669 | 1,994 | 74.9% |
| Ceiling fans | 651 | 329 | 322 | 49.5% |
| Dishwasher | 145 | 115 | 30 | 20.7% |
| Dryer | 891 | 891 | 0 | 0.0% |
| Lighting | 2,055 | 1,522 | 533 | 25.9% |
| Miscellaneous | 2,671 | 2,671 | 0 | 0.0% |
| Range | 447 | 447 | 0 | 0.0% |
| Refrigerator | 775 | 650 | 125 | 16.1% |
| Total kWh | 16,103 | 9,411 | 6,692 | 41.6% |
| Summer peak kW | 5.52 | 3.13 | 2.39 | 43.3% |
| Winter peak kW | 9.15 | 6.15 | 3.01 | 32.8% |
| 2 kWp PV kWh | --- | -2,386 | 9,078 | 56.4% |
| CO2 tons/year | 16.95 | 7.29 | 9.66 | 57.0% |
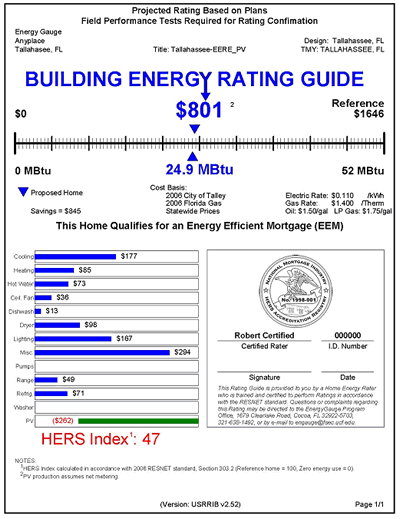
(Click image to see a larger picture.)
Residential Building Energy Efficiency and
Renewable Energy (EERE) Savings Potential
Tallahassee Peak Day Plots
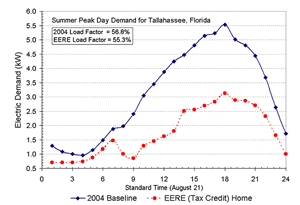 |
 |
(Click on graph to
view a larger image.) |
|
These tax credit qualification criteria are further defined in RESNET Publication 05-001, which may be downloaded at http://www.resnet.us/standards/tax_credits/procedures.pdf
The Florida Building Energy Efficiency Ratings Act of 1993 provides a uniform means for all Florida buildings to be rated for energy efficiency. The Florida Solar Energy Center is a nationally accredited Home Energy Rating System (HERS) Provider in accordance with the national standards for home energy ratings and the software used here for this purpose, EnergyGauge USA, is a nationally accredited HERS software tool.