

Reference Publication: James, P., Sonne, J., Vieira, R., Parker, D., Anello, M., "Are Energy Savings Due to Ceiling Fans Just Hot Air?," Presented at the 1996 ACEEE Summer Study on Energy Efficiency in Buildings. Disclaimer: The views and opinions expressed in this article are solely those of the authors and are not intended to represent the views and opinions of the Florida Solar Energy Center. |
Are Energy Savings Due to Ceiling Fans Just Hot Air?
Florida Solar Energy Center (FSEC)
FSEC-PF-306-96
Abstract
Human comfort studies have shown that people prefer higher temperatures when they are subjected to a breeze. Ceiling fans are often used to create air motion in residences. Simulation studies (including one given in this paper) have demonstrated that in Florida, using ceiling fans combined with raising a home's temperature 2° F will generate about a 14% net savings in annual cooling energy use (subtracting out the ceiling fan energy and accounting for internally released heat). This savings drops to 2.6% with a 1° F increase in set point and to a negative 3.7% savings with only a 0.5° F increase in set point. If the thermostat is not adjusted at all for fan use, cooling energy use may increase by 15%. The sensitivity of the simulation to changes in the convective heat transfer coefficient between indoor air and indoor surfaces from ceiling fan operation is also presented. The sensitivity is inconsequential for insulated houses.
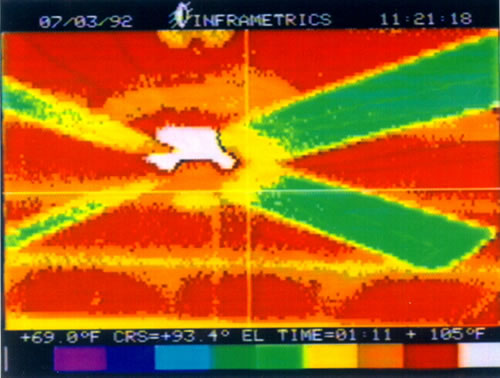
Figure 1. Ceiling fans give off heat and use electricity.
Photo of an operating ceiling fan taken with a heat sensitive
infrared camera. Color is proportional to temperature. The hot
center of the motor housing can clearly be seen (>105 °F).
A typical fan will use 50-150 Watts while operating at high speed.
This paper also presents metered results from an analysis of 400 Florida households that indicate no cooling energy savings due to ceiling fans. Homeowner-reported thermostat settings were the same for homeowners with and without ceiling fans and measured thermostat settings were not statistically different for a sample of homes in which the indoor air temperature was measured.
INTRODUCTION
Human comfort studies have shown that people prefer higher temperatures when they are subjected to air motion. When cooling is desirable, (i.e. under summertime conditions), air movement across the skin can increase comfort and/or be used to reduce energy use if, because of the cooling effect, thermostat set points are also raised. Comfort research based on Fanger's thermal comfort equation shows that at 60% relative humidity, 90% of people would be just as comfortable if the air dry bulb temperature were raised from 79.2° F to 82.5° F, if air speed was also increased from still air at 20 feet per minute to 150 feet per minute (fan on high). At 80% relative humidity, 90% of people would also be as comfortable if set points were raised from 77.9°F to 81.8°F while similarly increasing air speeds (based on Fanger 1982; McIntyre 1980).
Ceiling fans are often used to provide desirable air movement; they are very popular options in Florida residences. Because the fans have been shown to effectively increase comfort while potentially decreasing energy use, their installation and use has long been promoted by energy extension services, utilities and even through energy code compliance credit.
Ceiling fans save energy if their use also results in reduced air conditioner use. Fans can extend the natural ventilation season when the air conditioner is not in use and/or allow for higher thermostat set points. Calculations show that for the Florida climate, for every 1°F a thermostat is increased, cooling energy use is decreased by almost 10%-15% (Fairey et al. 1986). However, ceiling fans use energy and produce additional sensible heat load during the cooling season. So for fans to be of value as an energy conservation strategy, the energy use reduction benefits provided by the fans must offset the load they incur; the savings from raised thermostat set points must outweigh the additional electrical load from the motors and heating of the air.
An experimental energy conservation study published in 1984 monitored energy use in 16 houses in which, as part of the study, ceiling fans were alternately used and then disabled over one week periods (Lawrence 1984). It was estimated that the test spanned 2/3 of the cooling season. The study showed an average air conditioning energy use savings (including fan energy use) for the weeks the fans were used of 188 kWh/yr or 3.7%. Some of the houses did, however, experience a substantial negative cooling energy use savings; savings ranged from -38.7% to +28.9%. No thermostat set point or other more detailed schedule information was provided in the report.
In summary, comfort studies indicate that wind speed can be traded for temperature and simulation results indicate significant energy savings from small increases in thermostat set points. However, field research is limited and available data show savings are minor or inconsistent. So the rest of this paper attempts to answer two questions- how much energy can ceiling fans potentially save in Florida residences and are the fans being used in a manner that realizes these saving?
METHODOLOGY
Data from a simulation study, a home occupant survey and metered results from over 400 recently-constructed audited homes were used to evaluate energy savings of ceiling fans.
The simulation was conducted to show the relationship of residential cooling energy use to interior thermostat set points and fan use for three Florida cities- Jacksonville, Orlando and Miami. The house used in the simulation was specified to match typical Florida construction; its characteristics are shown in Table 1. The FSEC 3.0 (Florida Software for Environmental Computation 3.0) hourly computer simulation was used for the study (Kerestecioglu et al. 1992). FSEC 3.0 is an energy simulation software package that uses hourly weather data and actual building geometry to describe energy uses and loads. It can use either finite-element or transfer function methods to determine the building energy balance. For this model, an energy balance was performed using actual ceiling fan and cooling system data.
Table 1. Simulation House Description
Component: |
Description: |
General |
1500 sq. ft., east-west orientation w/ 8 foot ceilings |
Windows |
Single pane clear; Areas- n/s= 70 sq. ft., e/w=42 sq. ft. |
Walls |
0.5" drywall, R-11 insulation, hardboard siding |
Ceiling/Roof |
Flat ceiling, 0.5" drywall, R-19 insulation; asphalt shingles |
Floors |
Concrete slab-on-grade, uninsulated |
Infiltration |
Attic= 1.0 ACH; house=0.35ACH average |
Analysis was done using constant, 24-hour thermostat settings with fans in use, increasing interior temperatures by 0.5°F, 1.0°F and 2.0°F starting from a base temperature of 78°F, without fans (use of this base cooling set point for simulation and other analysis was supported by the results of the energy use survey described below). An additional run with thermostat set point of 78°F with fans in use was also performed to show the energy cost if thermostats are not adjusted for fan use. It was estimated that fans are run at medium speed and consume 40 watts each (Fairey et. al. 1986). The fan schedule assumed two fans in use from 4PM to 8AM, and one fan used from 8AM to 4PM for a total of 40 fan hours or total energy use of 1660 Whrs per day. The 40-hour total was derived from the survey described below. In examining where there might be a chance of input inaccuracy to the simulation, only the ceiling convective heat-transfer coefficient (the rate of energy transfer between the air and the ceiling for a given temperature difference) was considered questionable, so the effects of changes in the coefficient were also included in the simulation. The cooling season schedule was estimated as shown in Table 2.
Table 2. Simulation Cooling Season Schedule
| City | Months Included | Days |
| Jacksonville | June-October | 153 |
| Orlando | May-October | 184 |
| Miami | April-November | 244 |
An energy use survey of over 400 central and south Florida homeowners was also conducted together with a more limited monitoring study (Florida Power and Light 1995). Part of the survey and monitoring work was designed to determine the relationship between ceiling fan use, interior air temperatures and energy use in these houses. Homeowners were asked to estimate their summer and winter thermostat settings during both the week and weekend, for days (8AM-6PM), evenings (6PM-9PM) and nights (9PM-8AM). Questions on ceiling fans included the number of fans typically on at one time and how many hours the fans were used per day during both weekdays and weekends. Each house was also checked for eligibility for Florida Energy Code ceiling fan credit. Credit is given under the code if at least one ceiling fan is installed in all primary living areas and in each bedroom. Air conditioner energy use was also measured in each of the houses surveyed on a 15-minute basis throughout the cooling season. Interior air temperature was monitored in a sub-sample of 63 homes.
RESULTS
Cooling season simulation results for the three cities- Jacksonville, Orlando and Miami are shown in Table 3. The base run was for a 78°F thermostat setting without ceiling fans. Adding ceiling fan energy use and additional heat load while retaining the 78°F set point resulted in an average cooling energy use increase for the three cities of 10.5%. Raising the thermostat set point 0.5°F with fans in use increased overall energy use an average of 3.9% above the base case. Set points of 79°F and 80°F showed positive average cooling energy savings of 2.6% and 14.9%, respectively. The maximum savings difference between the three cities at any thermostat set point simulated was approximately 18%. Cooling energy use and savings vs. thermostat set point for Orlando are shown in Figure 1.
The sensitivity of the simulation to changes in the convective heat transfer coefficient between indoor air and indoor surfaces from ceiling fan operation was shown to be minor for insulated houses. Changing the coefficient from 8.3 Btu/h-ft2-°F to 12.0 Btu/h-ft2-°F changed results by less than 2%.
Table 3. Simulation Seasonal Energy Savings by Thermostat Temperature Set Point
| Jacksonville | Orlando | Miami | ||||
| T-stat °F
(Fan Status) |
Energy Use
(KWh) |
% Savings | Energy Use
(KWh) |
% Savings | Energy Use
(KWh) |
% Savings |
| 78 (w/o fans) | 2772 | Base | 4030 | Base | 5670 | Base |
| 78 (w/ fans) | 3091 | -11.5 | 4443 | -10.2 | 6230 | -9.9 |
| 78.5 (w/ fans) | 2891 | -4.3 | 4180 | -3.7 | 5871 | -3.6 |
| 79 (w/ fans) | 2700 | 2.6 | 3927 | 2.6 | 5520 | 2.6 |
| 80 (w/ fans) | 2338 | 15.7 | 3448 | 14.4 | 4840 | 14.6 |
The ceiling fan survey gave a mean of 4.3 ceiling fans in each house and occupants claimed to use an average of 2.5 fans at one time. The mean average use was 13.5 hours on weekdays and 14.2 hours on weekends. Over one third reported leaving their fans on 24 hours per day. For homes with fans, the average weekday use was 39.2 fan hours. Table 4 shows the relationship found between number of fans, interior temperatures (both reported and measured) and metered annual and peak day energy use. Homeowner-reported summer thermostat settings were approximately the same for homes with and without ceiling fans. The smaller sample of measured interior temperatures for July again showed no correlation between temperatures and ceiling fan availability or use. Figures 2a and 2b show the relation found between ceiling fan use and reported and measured interior temperatures. Comparing households that meet the Florida Energy Code requirement for ceiling fan credit with those without did show a slight (0.5°F) increase in thermostat set point.
Table 4. Influence of Ceiling Fan Operation on Thermostat Setting and Energy Use
| No.
of Fans Operating |
Reported
T-stat (oF) |
N | Measured July Int. Temp (oF) | N | Annual AC Use (KWh) | Annual AC Use (KWh/ft2) | Peak AC Use (kW) | Peak AC Use (W/ft2) |
0 |
77.5 |
18 |
- |
0 |
4133 |
2.38 |
3.00 |
1.76 |
1 |
77.3 |
80 |
78.5 |
15 |
4489 |
2.50 |
2.94 |
1.66 |
2 |
77.2 |
109 |
77.3 |
18 |
4067 |
2.28 |
2.79 |
1.55 |
3 |
77.9 |
86 |
78.6 |
12 |
4336 |
2.28 |
2.64 |
1.40 |
4 |
77.6 |
35 |
78.9 |
3 |
4678 |
2.39 |
3.27 |
1.66 |
5+ |
77.3 |
59 |
77.7 |
10 |
4399 |
2.24 |
2.57 |
1.35 |
Metered air-conditioning loads did not indicate savings due to ceiling fan use. Average annual air-conditioning energy use shows no trend towards reduced consumption as the number of fans in use increases. While annual air-conditioning use normalized by conditioned area shows a small reduction in consumption as ceiling fan operation increases, this result may be largely because larger houses having generally lower cooling energy consumption per square foot also typically have more ceiling fans. Also, a multi-variate analysis of influences on seasonal space cooling showed no statistically significant cooling energy use reduction from increased fan use. Ceiling fan use was found to reduce the peak day cooling demand when normalized by the site estimated Manual-J load but total house peak demand (including all end-uses and ceiling fans) for that day was higher as claimed fan use increased.
CONCLUSIONS
The simulation study affirms that significant cooling energy use savings are possible if ceiling fans are used in conjunction with higher thermostat set points. It also shows, however, that if fans are used with little or no corresponding thermostat adjustment, energy use can actually be increased. For cases in which homeowners are using fans without raising thermostats, potential savings based on these results if thermostats are raised could be as high as 25% (i.e. Table 3 for Orlando: -10.2% to +14.4%; 24.6% total savings difference).
The survey and monitoring results give no indication that ceiling fans are being used in a manner that saves energy. When the simulation results are also considered, the result that thermostats are not adjusted for fan use even suggests an increase in energy use corresponding to increased ceiling fan use. Note, however, that since the survey is based on homeowner responses there is some question as to how accurately these responses reflect actual practice. While the metered results do generally agree with the homeowner responses, a larger sample size or metered ceiling fan time use patterns would have helped to increase confidence in the results.
The combined simulation and survey results suggest that while residential ceiling fans are potentially of significant value for reducing cooling energy use, fan use practice is not realizing the potential savings available. This finding represents an important area of future study. Possible reasons for the differences in realized and actual savings include:
- Comfort studies show a range of temperatures people may be comfortable at under a given air speed and humidity level, and so ceiling fans may be improving comfort, but not cooling enough to cause occupants to increase thermostat set points.
- Occupants may be indifferent to energy savings or may not realize the savings potential
- Fans are left on when no one is in a room. Fans may be left on because occupants are not concerned with the cost of keeping the fan on, don't realize the cost, or have the false understanding that ceiling fans cool air and leave the fans on to cool rooms even when rooms are unoccupied. Survey results from this study indicated over 33% of respondents do leave fans on 24 hours.
- The comfort equations may not be accurate at the points simulated. Comfort studies done with varying wind speeds, humidity levels and temperatures are limited. Extrapolations may not be accurate.
- The fans may not be effectively increasing air speeds where the occupants are in the rooms. For example, many times kitchens are without fans, yet someone may be working in the kitchen and also may have a higher metabolic rate. Also, such rooms may be warmer than those surrounding leading to a decision not to increase thermostat settings. Another possibility is that since furniture is most often located at the walls, the air movement may not be reaching occupants.
Anticipated future work includes a more detailed fan use survey, a monitoring study and a small scale informational mailing with follow-up survey.
REFERENCES
Fairey, P., A. Kerestecioglu, R. Vieira, M. Swami, and S. Chandra. 1986. Latent and Sensible Load Distributions in Conventional and Energy Efficient Residences. Final report for the Gas Research Institute, Florida Solar Energy Center. Cape Canaveral, Fla., May.
Fanger, P.O. 1982. "Human Requirements for the Indoor Climate of Buildings." Paper presented at the International Passive and Low Energy Alternatives Conference, Biological Station for Research, Bermuda, September 6.
Florida Power and Light. 1995. New Home Construction Research Project Findings, Results and Recommendations: Final Report. Presented to the Florida Public Service Commission, Florida Power and Light Company, Miami, Fla., June.
Kerestecioglu, A., M. Swami, L. Gu, P. Brahma, P. Fairey, and S. Chandra, 1992, User's Manual of FSEC 3.0 (Florida Software for Enervironmental Computation, Version 3.0), FSEC-GP-47-92, Florida Solar Energy Center, Cape Canaveral, Florida.
Lawrence, W. T. 1984. Field Test Measurement of Energy Savings from High Efficiency, Residential Electric Appliances. Florida Public Service Commission.
McIntyre, D.A. 1980. Indoor Climate. London: Applied Science Publishers Ltd.
Presented at the 1996 ACEEE Summer Study on Energy Efficiency in Buildings.
© 2007-2014 University of Central Florida. The Florida Solar Energy Center (FSEC)
is a research institute of the
University of Central Florida.
For more information about FSEC, please contact us or learn more about us.
Find us on Facebook!