

Reference Publication: Parker, D., Mazzara, M., Sherwin, J., 1996. "Monitored Energy Use Patterns In Low-Income Housing In A Hot And Humid Climate," Tenth Symposium on Improving Building Systems in Hot Humid Climates, Ft. Worth, TX, p. 316. Disclaimer: The views and opinions expressed in this article are solely those of the authors and are not intended to represent the views and opinions of the Florida Solar Energy Center. |
Monitored Energy Use Patterns In Low-Income Housing In A Hot And Humid Climate
Florida Solar Energy Center (FSEC)
FSEC-PF-300-96
ABSTRACT
The Florida Solar Energy Center (FSEC) is metering energy use in two Habitat for Humanity developments. The objective is to understand how energy is used in low income housing and how it can be effectively reduced.
The ten "control homes" come from a conventional housing project built by in 1993 Habitat for Humanity in Homestead, Florida. Another ten "experimental homes" have been recruited from the 190 home Jordan Commons development in the same vicinity. These houses, which are soon to be metered, are designed to be energy efficient with high SEER air conditioners, reflective roofing, solar water heaters and energy efficient lighting and appliances.(1)
The instrumentation was installed in the control homes in July of 1994 with a year of 15-minute data now collected on all sites. Data are obtained on seven electrical end-uses (air conditioning, heating, hot water, dryer, range, refrigerator, washer/freezer) as well as total. Weather conditions are also monitored as well as interior comfort conditions (temperature and humidity) and hot water consumption and window ventilation status. The field data allow unique insight into how energy is used in low income housing in a hot and humid climate.
THE HOMES AND THEIR OCCUPANTS
The control group homes for the Jordan Commons study are located 16 km away in Florida City, just south of Homestead, Florida. There are two similar building models in the project, both with rectangular floor plans. The houses with three bedrooms have a conditioned floor area of 96 m2 (1030 square feet); the four bedroom models total 111 m2 (1190 ft2). The construction is conventional for South Florida: concrete block on an uninsulated monolithic slab with an exterior light colored stucco finish. The homes generally face north or south with a small porch over the entrance. The roofs are of standard A-frame construction with plywood decking covered by asphalt shingles. The concrete block walls are insulated with RSI-0.5 m2K/W (R-3 ft2hrF/Btu) insulation on the interior; the attic has RSI-3.3 (R-19) fiberglass batts over the sheetrock ceiling. The windows are single glazed units with aluminum frames and are single-hung so that about 30% of their gross area can be opened for ventilation. Most of the homes' windows are located on north or south exposures. Several homes in the development are shown in Figure 1.
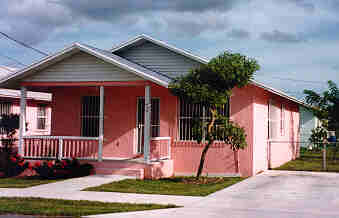
Figure 1. A view of the Habitat homes in the Florida City
development.
The mechanical cooling system in the houses consists of 7.0 kWt(2.0-ton) air conditioners in the three bedroom homes and 8.8 kWt(2.5-ton) air conditioners in the four bedroom units. The split systems are conventional with an interior evaporator and air handler located in a small utility room.
The air-cooled condenser is located outside with the R-22 refrigerant
piping from the evaporator insulated to RSI-0.9 (R-5) with foam insulation.
The units have a rated seasonal coefficient of performance (SCOP) of
3.5 We/Wt (SEER = 12.0 Btu/W). Heating is provided by 4.8 kW electric
resistance elements (7.1 kW in four bedroom homes) located in the air
handling unit.
The conditioned air is distributed through a ducted system in
the attic to ceiling mounted supply registers. The air distribution
system consists of approximately 15 m (50 ft) of RSI-0.9 (R-5) flex
duct. A thermostat is located on an interior wall. The slide type control
has a set range from 10 - 32oC (50 - 90oF) with two toggle switches
for mode selection (heating/ off/ cooling). The fan mode selection
has two modes: "on" where the fan runs constantly regardless
of the compressor operation and "auto" in which the fan operates
only when the heat strips or compressor is energized.
The major appliances in each home are a 154 L (40 gallon) electric resistance storage water heater, a 510 L (18 ft3) refrigerator, an electric clothes dryer, range, and a washing machine. Several homeowners have added a chest freezer. Except for the refrigerator, all the appliances are located in a small conditioned utility room. Lighting in the homes is of the conventional incandescent type. Typical minor appliances include a living room ceiling fan, microwave oven, video cassette recorder, television, and stereo.
The occupant density is fairly high. Whereas occupants number 2.4 in the average Florida household, the Habitat homes have an average of 4.6 members. The households vary from a maximum of eight occupants per home to a minimum of three and all have one or more children of varying ages. Although income information is not available, Habitat for Humanity's mission is to provide affordable housing for low-income families. Each household has been in residence for a year or more and although the homeowners have an interest free mortgage payment for their homes, they are responsible for payment of their monthly utility bills. During audits, we found the head of household at each house to be very aware of their monthly utility expenses. At least one family (House 4) has only very limited prior experience with air conditioning systems.
MONITORING AND DATA SUMMARY
In April, of 1994, research engineers visited the ten sites in Florida City. The homeowners were interviewed after which each site was audited and physically measured for instrumentation. Multi-channel data loggers and associated metering equipment was installed in June of 1994 with the site data collection system becoming operational by mid-July.
Detailed performance data are being collected at each house, including energy use of all major appliances, meteorological conditions and interior house conditions such as temperatures, water use and window ventilation status. A detailed description of the instrumentation is contained in a source report (Parker et. al., 1994).
A unique part of the monitoring process is the ability to detect when the home's windows are opened for natural ventilation. Contact switches were installed on the most commonly opened windows for ventilation. This allows researchers to determine the fraction of each data interval during which the building's windows are opened for natural cooling.
Impacts of internal heat gains from appliances and occupants on space cooling energy use is widely acknowledged (Abrams, 1986). Typically such sensible heat must be removed from the interior to meet the thermostat setting. Another innovative part of the monitoring protocol is that all electrical end uses that take place within the potentially conditioned space are submetered so that interior levels of appliance heat gain can be assessed in their impact on air conditioning needs. Miscellaneous electricity use for lighting and other plug loads are obtained by differencing the total recorded site electrical use from the recorded energy use of the various sub-metered major appliances.
The data loggers scan the various instruments at 5 second intervals and integrated or totalized values are output to storage every 15 minutes. Data are transferred from the data loggers via modems and dedicated phone lines to a mainframe computer each evening.
In December, 1994, the person primarily responsible for controlling the cooling system, was interviewed at each home. The interview questions were designed to provide detailed information about how the systems are controlled as well as the occupant's reasons for operating the systems as they do.
Table 1 and Figure 2 summarize a break-down of measured daily energy end-use in the ten homes from September 1, 1994 to August 31, 1995.
These data provide insight into the magnitude of AC electricity consumption relative to other household energy end-uses during the cooling season. About 40% of the daily average electricity use is for air conditioning. The next largest end-use, water heating, is much lower at 19% of total consumption.
Table 1
Average Daily Energy-End Use at Habitat Sites: August 31, 1994 - September 1, 1995
kWh/Day
| Site | Bedrooms | Occu-
pants |
Total
kWh/ Day |
AC
kWh |
Air
Hndlr |
Heat
kWh |
Int.
Temp (oC) |
DHW
kWh |
Dryer
kWh |
DHW
Gals |
Range
kWh |
Refrig.
kWh |
Freez.
kWh |
Miscel.
kWh |
| H01 | 4 | 8* | 53.7 | 17.6 | 2.7 | 2.0 | 24.2 | 9.9 | 5.1 | 81.7 | 1.9 | 2.4 | 0.9 | 11.0 |
| H02 | 3 | 4 | 55.6 | 17.4 | 2.4 | 0.0 | 24.4 | 13.0 | 1.9 | 113.0 | 4.7 | 2.4 | 1.0 | 12.8 |
| H03 | 3 | 3 | 36.5 | 12.3 | 1.6 | 2.0 | 25.1 | 6.2 | 3.7 | 38.5 | 1.4 | 2.3 | N/A | 6.6 |
| H04 | 4 | 8 | 53.7 | 10.0 | 2.8 | 0.5 | 25.7 | 12.4 | 9.2 | 110.3 | 5.1 | 3.4 | N/A | 10.3 |
| H05 | 4 | 3 | 38.7 | 11.1 | 1.8 | 2.8 | 25.3 | 5.6 | 5.3 | 55.9 | 1.2 | 2.3 | N/A | 8.2 |
| H06 | 3 | 5* | 45.9 | 17.2 | 2.4 | 0.8 | 23.2 | 9.9 | 3.5 | 82.4 | 1.4 | 1.9 | 2.1 | 6.5 |
| H07 | 3 | 4* | 35.8 | 13.0 | 2.2 | 1.2 | 25.9 | 6.1 | 2.9 | 48.3 | 0.9 | 2.2 | N/A | 7.1 |
| H08 | 3 | 5* | 59.0 | 24.4 | 4.3 | 0.5 | 22.7 | 10.4 | 4.4 | 59.8 | 1.6 | 2.5 | 3.9 | 7.1 |
| H09 | 3 | 3* | 21.1 | 4.7 | 0.6 | 5.3 | 26.7 | 2.7 | 0.5 | 18.1 | 0.1 | 2.4 | N/A | 4.7 |
| H10 | 3 | 3 | 27.7 | 8.5 | 1.2 | 0.6 | 25.4 | 4.0 | 0.7 | 27.9 | 0.9 | 2.0 | N/A | 9.7 |
Avg. |
3.3 |
4.6 |
42.8 | 13.6 | 3.8 | 1.6 | 24.9 | 8.0 | 3.7 | 63.6 | 1.9 | 2.4 | 2.0 | 8.4 |
* Relatively constant thermostat setting.
Totals may not agree due to rounding.
TOTAL ENERGY USE
Average total electricity consumption in the group of ten Habitat homes totaled 43 kWh/Day. However, use was quite variable from one household to the next with a range of 21 to 59 kWh per day and a standard deviation nearly half the mean value. The seasonal variation in total energy use was also pronounced-- presumably due the seasonality of the various end-uses which make up the total. Figure 3 shows the average annual consumption for the entire group of ten plotted by month so that the seasonality of the load profiles can be seen.
The data clearly show peak total electricity consumption occurs in the summer months although December also shows the evidence of heating.
Figure 4 shows the average 24 hour electrical demand profile over the entire year for each house in the Habitat control group along with the mean value for the group and the minimum and maximum.
Interestingly the homes using both the most energy and least were two identically sized homes immediately adjacent to each other (House 8 and 9). The demand is somewhat bi-modal, with both a morning and evening peak, likely related to occupancy.
VARIATION IN SPACE COOLING ENERGY USE
Since the Florida City Habitat homes are virtually identical and have the same models of air conditioners and appliances, the metering allows examination of the differences in space cooling that are attributable to occupant behavior and physical factors. In installing the equipment, FSEC technicians were careful not to alter equipment settings or suggest changes to occupant behavior.
The variation of space conditioning needs arising from occupant behavior has been consistently noted in previous monitoring efforts. Early studies at Princeton's Twin Rivers project showed differences between otherwise identical townhouses of 2:1 in space conditioning energy (Sonderegger, 1978). Similarly, a study of air conditioning use in 25 homes in Palm Beach, Florida showed a 100:1 variation in space cooling energy, mainly based on differences in ventilation behavior (Parker, 1990). The variation was still 7:1 when primarily air conditioning households were considered.
Data from the Habitat project show that space cooling energy use is approximately 40% of annual electricity use. Mean air conditioning use among the three and four bedroom homes was similar (13.9 and 12.9 kWh/day, respectively). This suggests that factors other than intrinsic physical differences are responsible for the large variation in space cooling energy use.
Average annual air conditioning (AC) energy use totaled 13.6 kWh/Day (4,970 kWh/yr), but ranged from 4.7 - 24.4 kWh from the highest to lowest user-- a ratio of nearly 5:1. In the "auto setting" the air handlers in the Habitat homes operate when the compressor is on and add approximately 225 W to the demand when the thermostat calls for cooling. When air handler (AH) energy use is included, the total space conditioning energy use increases to 17.4 kWh/Day. However, it is important to note that recorded AH energy cannot be simply added to arrive at annual totals since the strip heating is on the air handler circuit. Also, examination of the data show that Houses 4, 6 and 8 frequently left the fan control in the "on" position resulting in increased space cooling energy use and less effective dehumidification. Figure 5 shows a comparison of air conditioning energy use indexed to several key variables of interest (number of occupants, house bedrooms and thermostat setting).
Research literature suggests that the origin of these differences are behavioral in nature (eg. Stern ed., 1985; Kempton et al., 1992; Lutzenheiser, 1992). Occupants can express differences in their modes of cooling system control based upon "on-off" scheduling, interior temperature settings, ventilation and window behavior, use of drapes and blinds and zoning of supply registers.
Interviews were conducted with the occupants of the homes in December of 1994 to learn about energy use habits. The collected data showed that households were split between a relatively constant setting and one that was "switched" on a daily basis either by turning off the air conditioner or by adjusting the thermostat setting.
Large differences were discovered in the maintained interior temperature between households (from 22 - 27oC or 71 - 81oF), and to some extent, within households. The behavioral aspects of the differing air conditioner control strategies observed in the project are detailed elsewhere (Parker et al., 1995). However, the energy use data clearly showed that the selected thermostat setting played a large role in determining space cooling energy use.
AC ENERGY USE PROFILES
As expected, AC consumption showed a strong degree of seasonal variation. Figure 6 shows how average AC consumption for the group of ten varied by month during the monitoring period.
The greatest surprise comes from the degree of air conditioning used during non-summer months. AC consumption in December was far from negligible.
The need for space cooling is largely temperature driven, and thus includes a strong diurnal component. The measured outdoor air temperature at the sites reflects the climate, averaging 24.0oC (75.2o) over the entire year with a range from 3.8oC (38.8oF) (February 9th) to 34.1oC (93.4oF) (August 15th). However, the attics of the homes showed significantly greater temperatures than those outdoors. Figure 7 shows the daily average attic air temperature profile in the group of homes over the entire year.
Although the homes have RSI 3.3 (R-19) insulation, the less insulated cooling air distribution system is located in the unconditioned attic. The average temperature reaches a peak at 1:30 PM of 36oC (temperatures during summer months are even hotter). Interestingly the maximum values in the plot are from House 5 which has dark gray asphalt shingles; the lowest temperatures are from House 2 with off-white asphalt shingles. Previous research has already demonstrated the large impact reflective roof surfaces have on residential cooling loads (Parker et al., 1995B). The peak difference was 4oC from the choice of color, its effect on solar absorptance and attic air temperature. Figure 8 shows the average 24-hour AC energy demand at the ten sites over the entire year.
The information provides a clear picture of the variation in AC usage patterns from one site to the next as well as the overall trend for the group. The average peak demand at 3 PM EST is more than twice the minimum value at 6 AM. A statistical model was used to examine how annual cooling energy use varied with physical parameters expected to influence cooling demand. Results from a regression model (Figure 9) indicate that recorded interior temperature (a surrogate for thermostat setting) can explain much of the observed variation from one home to the next:
kWh = 4.633 + 4.199(Tint)
[6.24] [6.69]
R2 = 0.85
Where:
kWh = Daily average AC electricity use (kWh; avg = 13.6]
Tint = temperature difference between interior and 27C (highest interior temperature, avg = 2.14)
The values in brackets are the coefficient t-statistics. Various forms of multiple regression were attempted using numbers of bedrooms, occupants, relative humidity and other factors. However, little improvement was made to the simple model above.(2)
This analysis indicates that the most important determinate of air conditioning energy use is the average temperature maintained within the space. Thermostat control behavior (switched/adjusted vs. constant) is important to the extent that interior air temperature are allowed to float. For instance, the average temperature maintained in those homes with a constant thermostat setting averaged 24.5oC against 25.2oC for those switching off the air conditioner or adjusting up the thermostat when away from home.
The results suggest approximately a 25% increase in space cooling energy for each degree centigrade which the interior is cooled below 27oC. Significantly, House 9, which maintained approximately a 26.7oC (80oF) set point and a constant thermostat setting used the least cooling energy (4.7 kWh/Day) of all households. The neighboring House 8, with the lowest interior temperature (22.3oC), used the most cooling energy (24.4 kWh/Day). When the later home was audited, it was discovered that the cooling thermostat was positioned at the minimum setting (10oC) resulting in nearly continuous compressor operation.
House 4 had the most unpredictable use of air conditioning of the houses studied. On many days the air conditioner would not be used at all with the windows often opened for ventilation. Air conditioning would be most frequently used for comfortable sleeping during nighttime hours. However, based on interviews with the homeowners the thermostat was set to 21oC or less (70oF) so that when the air conditioner was activated, it did not cycle off until it was manually switched off the following morning. On days where the AC was on continuously, the house interior temperature reached as low as 17.6oC (64oF). In several instances air conditioning was observed at House 4 while the windows were open. In other cases, the occupants at House 5 were observed to move directly from cooling to heating when continuous AC operation brought on very low temperatures. These data suggest that the households could benefit from instruction on how to use their AC system more effectively.
Also, the magnitude of the cooling energy consumption in these homes indicates that the efficiency and capacity of cooling system equipment is of fundamental importance to controlling monthly energy expenses. The energy efficiency ratio (EER) of cooling equipment has direct implications for the energy use of air conditioning equipment. However, less discussed is the importance of equipment sizing as a determinate of consumption. The ability of a 2.0 ton cooling system in a 96 m2 (1,030 ft2) home to provide measured interior temperatures less than 65oF (18oC) during summer suggests that air conditioning equipment might be intentionally down-sized to control for poor judgment in operation. On this basis, sizing equipment down by one half ton will still allow occupants to achieve comfortable temperatures without excessive waste. Also, smaller capacity equipment will provide improved dehumidification due to increased compressor runtime fraction and small further improvements to cooling efficiency from decreased compressor cycling losses.
NATURAL VENTILATION
At the time of audit, each homeowner indicated the window most commonly used when they desired to open up the house for natural ventilation. A magnetic contact switch was placed on the indicated window so that information might be obtained regarding ventilation behavior. The data were returned as the fraction of each 15-minute measurement interval during which the chosen window was open. Later, each household was interviewed to see what factors caused them to choose or not choose natural ventilation. Several surprises emerged from the data. The first was that natural ventilation was not commonly utilized. The second surprise was that those ventilating did not usually do so during nighttime hours when ambient temperatures were lower. The third unexpected finding was that there was little of the expected seasonality to natural ventilation at the ten homes.
Figure 10 shows the annual data for all ten homes when averaged over the daily cycle.
As shown, only one dwelling, House 4, relied consistently on natural ventilation. Here, the household ventilated out of necessity rather than choice, however. The low income of the family dictated that air conditioning only be used sparingly. The cooling strategy was to air condition the home during evening hours between 10 PM and 6 AM and to use windows for cooling during the daytime hours. However, excessive temperatures were recorded on the home interior during ventilation. Between June and September afternoon temperatures were recorded frequently in excess of 32oC (90oF).(3)
House 2 also opened windows frequently, but the reason here was "to get some fresh air" rather than any attempt at offsetting air conditioning costs. Other homes, such as House 8, scarcely opened their windows during the entire year. Most gave their reasons for not ventilating as "too hot and too humid" outside, although a number voiced concerns for household security.
SPACE HEATING
The semi-tropical climate in South Florida makes space heating a transitory phenomenon in the winter months. All the homes have electric resistance strip heat installed in the air handlers. The heating system is activated by selecting heat with the two position thermostat. The recorded data shows that during the winter of 1994 -1995 there were only 66 days when the homes used space heat. The number of days when heating was used varied even more by site than did cooling. House 2 used no heating at all whereas House 9 heated on 66 days. Moreover, on an average of 27% of days when heating was used during the morning hours, air conditioning followed later in the afternoon.
By analyzing the data on colder days, we were able to separate heating from cooling days in order to sum the space heating energy from air handler operation associated with cooling. We found that the temperature preferences of the various households in summer months were also reflected in winter thermostat settings. Those that preferred warmer temperatures in summer generally used more for heating and heated on more days in the winter. Space heating comprised an average of 1.6 kWh/Day or approximately 4% of total annual energy consumption. Figure 11 shows the 24-hour electrical demand profile associated with this consumption on days when heating was needed.
The days in which heating was observed in any of the homes stretched from November 14th to April 2nd, although there were only 17 days during this period where more than half of the homes were observed to heat (December 24th - February 10th). Heating was concentrated in a six week period. As shown by the plot below, the average daily heating profile reflects a strong demand during a short morning period followed by rapid decline at 10 AM. Of interest is the fact that AC demand was not insignificant in the later afternoon on days when heating was used.
Similar to the cooling systems, control of space heating in the homes does not always appear rational. In one of the homes, which typically maintains very low interior temperatures when cooling, the occupants were observed to move directly from air conditioning operation to space heating. This further underscores the need for proper education of occupants in the intelligent operation of heating and cooling equipment.
DOMESTIC HOT WATER
All the water heating systems in the homes are identical: 40 gallon (154 L) storage tanks with dual upper and lower 3,375 W electric resistance elements. The tanks are insulated to RSI 2.8 (R-16), have an energy factor of 0.89 and are installed in a semi-conditioned utility room. Given the intrinsic similarity of the water heating systems, the major differences in hot water heating energy consumption from one home to the next is primarily due to hot water consumption and to a lesser extent on different water heater set points. Average hot water consumption totaled 64 gallons per day, but with a large range of 18 - 113 for individual households. Consumption appeared loosely tied to number of household occupants.
One time thermostat set point measurements were taken at each house and 15-minute data were available from each household providing the gallons of water consumed and the watt hours of energy used for water heating. The measured average hot water temperature on audit was 53oC (127o F) with a range from 49.4 to 61.1o C (121 - 142o F). We noted that measured hot water temperature was often slightly warmer than the set value on the tank thermostat.
Figure 12 shows the variation of average daily hot water energy use at each house against the average number of gallons of hot water consumed.
The data show the expected trend; hot water consumption is the main driver of water heating energy use with each ten additional gallons of consumption resulting in another daily kWh of electricity use.
Seasonal use variations are due to changing hot water usage patterns and tank water inlet temperature over time. The homeowners tended to use more hot water during the cooler part of the year and less during summer months. Also, a portion of the seasonal variation is intrinsic to the heating load itself as the temperature of the water entering the house varies with outdoor ground temperature. Figure 13 shows the monthly variation of average kWh/day for water heating and other appliance loads.
Only water heating and lighting/plug loads showed an intrinsic seasonality to their use; the other end-uses were fairly random in their fluctuations from one month to the next. Lighting and plug loads are largest in December and January with increased hours of illumination and also in summer with increased use of ceiling and floor standing fans.
Electricity consumption for water heating varied more than did hot water use, indicating that the Wh per gallon of heated water varied over time. This is primarily due to the changing entering tap water temperature into the home as shown by the average daily values shown in Figure 14. Two sites also had the inlet tap water temperature measured during periods when water was drawn from the tank. The inlet water temperature varied by more than 5o C over the year, being strongly influenced by the daily outside air temperatures.
The changing hot water usage pattern over the daily cycle reflects the schedules of the household occupants. In general, most homes have two periods of large hot water use in the morning and evening which coincide with household bathing and showering patterns. Figure 15 shows the variation of hot water energy use with the time of day.
Since occupancy is a critical determinant of hot water consumption, we compared that measured in each house in the Habitat control group with the number of household members. We found there was a relationship although the data showed that other factors associated with the behavior and preferences of the occupants account for a large portion of the variance which is unexplained by the occupant number itself.
The implications of the above data indicate that measures which reduce hot water use, such as flow showerheads, will be most important to controlling water heating energy costs. Proper setting of hot water tank thermostat may be another no cost opportunity for reduction.
REFRIGERATION
All the homes have the same model of refrigerator located in the kitchen. The unit is a basic 1993 top-freezer model (Hotpoint CTX18 BAS) with automatic defrost with a total volume of 18.2 cubic feet. The DOE label energy use is $58 for an estimated annual energy use of 697 kWh (1.91 kWh/Day). The electricity consumption of the refrigerator was separately metered in all the homes. The average was 870 kWh/yr with the mean strongly affected by the refrigerator at House 4 which exhibited significantly greater demand than the other units and may be malfunctioning. As seen in Figure 16, the daily refrigerator load profile is relatively flat with slightly higher consumption in evening hours after meal preparation. Little seasonal variation in consumption was observed as shown in Figure 13.
In addition, five of the homes have added separate freezers to the utility room since construction. The freezers vary by type (chest vs. upright) manufacturer, size and vintage. One of the freezers failed during the course of the monitoring and was not replaced. In each case the freezers were separately metered since they are a major energy-using appliance. Energy consumption was extremely variable from one unit to the next, although we found that the magnitude of the freezer energy consumption was nearly as large as that of the refrigerator unit.
Perhaps the largest indication is that the occupants may prefer additional food storage over that originally provided. The obvious remedy is to provide additional refrigeration capacity in the standard refrigerator. However, what is unknown is whether such an accommodation would discourage occupants from purchasing still greater refrigeration volume. Unfortunately, if middle-income homes in Florida are any indication, a larger refrigerator may not translate into decreased desire for a separate freezer.
DRYER ENERGY USE
Each home has a front-load three-cycle electric clothes dryer of a conventional type. Clothes drying was found to be a fairly large energy use in the homes with an average consumption of 3.7 kWh/Day (8% of total). Since the units are identical, differences in energy use are linked to number of occupants and clothes washing habits. None of the homes used manual clothes lines and dryer use varied from 2.6 kWh/day for 3 person households up to 7.1 for those with more than five occupants.
There was little discernable seasonality to dryer energy use (Figure 13). However, there was variation with the daily time domain. Figure 17 shows that dryers were often used either during the morning hours or later in the evening.
Given the magnitude of dryer energy consumption, an obvious recommendation is to promote substitution of clothes lines. Unfortunately, there is often an income-related social stigma associated with clothes line use and the frequency of rainfall in South Florida exacts another limitation. The success of the Jordan Commons project in advocating increased clothes line use will have to be judged once the project is complete and any differences in the frequency of dryer use can be assessed.
RANGE ENERGY USE
All the homes have an identical electric range/oven. The units were conventional with four coil-type resistance cook top elements and an oven below. With the fairly large households in the Habitat homes, it was expected prior to metering that cooking energy use would be rather large. This hypothesis was not born out by the analysis, however, which found oven and range electricity use to be lower than most other end uses. Average range electricity consumption was 1.9 kWh/Day, and did vary somewhat by household size. As seen in Figure 13, range use did not vary consistently by season.
However, as expected, the daily electricity demand profile was associated with meal times, particularly with dinner preparation (Figure 18).
Few means exist with which to reduce the energy consumption of cooking energy other than added reliance on microwave ovens (which all the control homes possess). Education on preferred cooking methods may be beneficial, although judgment will have to await data from the experimental group of homes. Power status feedback may also be of some help. We noted that at least one site, burners were frequently left on during late evening hours, probably by accident.
CLOTHES WASHER ENERGY USE
Each home was provided with an identical top loading clothes washer (Hotpoint WWA 5600). Although clothes washers are provided with an energy label, these may not be particularly meaningful for estimating energy use in a hot climate, since the label value includes hot water consumption.
Clothes washer electricity consumption averaged only 0.3 kWh/day or less than one percent of total loads in the five households in which it was metered. There was little evident pattern to clothes washing over the daily cycle (Figure 19) and even less variation seasonally.
The data show that clothes washer energy use was minor. A comparison was made between daily clothes washer energy use and hot water consumption to identify those households which either used a "warm" or hot water wash. The comparison showed that three households did use some hot water in clothes washing, indicating a possible opportunity to reduce consumption.
LIGHTING AND OTHER ENERGY USE
"Other" energy use consists of lighting and plug loads and was calculated by differencing total energy loads and the component end-uses. The lighting in all of the homes is conventional with incandescent bulbs used throughout. Ceiling fans, a common miscellaneous energy use in Florida homes, is notably lower in these homes since only a single unit was installed in the living area.(4) The energy consumption of lighting, televisions and other plug loads were obtained for each site by differencing the measured energy end uses from totals. All of the homes had at least one television, a microwave oven and a radio or stereo. The results showed that this miscellaneous energy consumption was surprisingly large: 19% or 8 kWh/day of total use. As seen in Figure 13, there is definite seasonality to these loads-- particularly during the month of December when holiday lighting may be influencing results.
Examination of its daily load shape, shown in Figure 20, suggests the portion of the end use that is associated with lighting, which is characterized by a small elevation in miscellaneous loads during the early morning, and a larger increase during evening hours peaking at 9 PM.
If the lowest point in Figure 20 (220 W) is taken as the household "base load," the difference may be a close proxy for the lighting portion on electricity consumption. On this basis, lighting energy consumption is approximately of 1.9 kWh/day or 4% of overall consumption.
The planned improvement for the Jordan Commons development is to use fluorescent and compact fluorescent lighting for as much of the interior lighting as possible. If such a strategy could cut lighting energy use in half, this could be expected to save approximately 350 kWh/year.
CONCLUSIONS
Field research from ten monitored homes built by Habitat for Humanity in South Florida suggest that several very different energy usage patterns are prevalent in individual homes-- particularly with regard to cooling strategies. Total measured electricity consumption averaged 43 kWh/day (15,620 kWh/yr). While conventional wisdom among Habitat affiliates has suggested that water heating is the predominate household energy use, the data revealed that space cooling is by far the largest energy end-use in South Florida's climate (40% of annual energy consumption at 17 kWh per day). The relative magnitude of the other measured end-uses was: water heating (19%), clothes drying (8%), refrigeration (8%), range (4%), space heating (4%), clothes washer (1%) and lighting and plug loads (19%).
Data analysis also indicates that very different air conditioner usage patterns are prevalent in the homes, with large impact on energy consumption. Although similar in construction, cooling energy in the houses varied by approximately 5:1 from the highest to the lowest. However, interior thermostat set point temperature was found to account for 85% of the variation. Each degree centigrade lower that the thermostat was set increased daily air conditioning (AC) use by an average of 4.2(+1.27) kWh or 25%. Our analysis suggests that programs which emphasize efficient control of space cooling systems may be very effective in controlling utility costs in such homes. Education also appeared important, since a number of homes were observed to use air conditioning in the "fan on" mode, reducing both efficiency and dehumidification. Other adverse habits observed included, air conditioning with windows open, setting of AC thermostats to the lowest position and use of heating when the building was overcooled.
Consumption of hot water in the homes averaged 64 gallons per day, (mean electricity use was 8 kWh/day) but ranged greatly from one home to the next and was loosely tied to the number of household occupants. As expected, hot water consumption was found to be the primary driver for hot water electricity use. Thus, devices such as low showerheads, which reduce consumption, represent prime opportunities for energy savings.
Refrigerator energy use for the 18 cubic foot model in each house averaged 2.4 kWh/day although five of the households elected to add a separate freezer in the small utility room. In these houses, the four monitored freezers, of mixed type and vintage, nearly doubled the refrigeration energy load averaging 2.0 kWh/day. Thus, it appears that low-income programs might consider either larger refrigerator/freezers to accommodate the needed food storage space or make provision for purchase of an efficient separate freezer for those homes desiring them.
Energy consumption associated with dryer (3.7 kWh/day) and range use (1.9 kWh/day) appear a function of household size and habits. Other than advocating clothesline use or substituting natural gas, these end uses may not be directly amenable to reduction. Clothes washer electricity consumption was minimal (0.3 kWh/day) and only three of the homes showed signs of using hot water for wash cycles. "Other" energy use, which comprised lighting and plugs loads was surprisingly large, however, at 8 kWh/Day (19%). Lighting energy consumption was obvious within the daily demand profiles with a consistent morning and evening peak. Based on our analysis, lighting energy use is on the order of 1.9 kWh/day. This end-use should be reducible using fluorescent and compact fluorescent lighting fixtures.
ACKNOWLEDGMENT
This research was funded by the Florida Energy Office whose support is gratefully acknowledged. Special thanks to the homeowners in Florida City and the staff at Homestead Habitat for Humanity. Steve Richardson, Stephen Barkaszi and John Broughton helped with the installation of the metering equipment. Wanda Dutton and Jon Klongerbo assisted with graphics and manuscript preparation.
REFERENCES
Abrams, D.W., 1986. Low Energy Cooling, Van Nostrand Reinhold, NY.
Gladhart, P.M. and Weihl, J.S., 1990. "The Effects of Low Income Weatherization on Interior Temperature, Occupant Comfort and Household Management Behavior," Proceedings of the 1990 Summer Study on Energy Efficiency in Building, Vol. 2, p. 43-52, ACEEE, Washington, DC.
Kempton, W., Feuermann, D. and McGarity, A.E., 1992. "'I always turn it on super': user decisions about when and how to operate room air conditions," Energy and Buildings, 18, p. 177-191, Elsevier Sequoia, Netherlands.
Lutzenhiser, L., 1992. "A Question of Control: Alternative Patterns of Room Air Conditioner Use," Energy and Buildings, 18, p. 193-200, Elsevier Sequoia, Netherlands.
Parker, D., Fairey, P., Gueymard, C., McCluney, McIlvaine, J. and Stedman, T. 1992. Rebuilding for Efficiency: Improving the Energy Use of Reconstructed Residences in South Florida, FSEC-CR-562-92, prepared for the Florida Energy Office and the U.S. Department of Energy, Florida Solar Energy Center, Cape Canaveral, FL.
Parker, D. S., 1990. "Monitored Residential Space Cooling Electricity Consumption in a Hot Humid Climate," Proceedings of the 1990 Summer Study on Energy Efficiency in Buildings, Vol. 9, p. 253, American Council for an Energy Efficient Economy, Washington D.C.
Parker, D.S., Barkaszi, S.F., Sherwin, J.S. and Richardson, C.S., 1994. Demonstration of Energy-Efficient Housing at the Jordan Commons Project, FSEC-CR-735-94, Florida Solar Energy Center, Cape Canaveral, FL.
Parker, D.S., Barkaszi, S.F., Sherwin, J.S. and Richardson, C.S., 1995. "Central Air Conditioner Usage Patterns in a Hot and Humid Climate: Influences on Energy Use and Peak Demand," FSEC-CR-776-95, Florida Solar Energy Center, Cape Canaveral, FL.
Parker, D.S., Chandra, S., Barkaszi, S.F. and Beal, D.J., 1995B. "Measured Cooling Energy Savings from Reflective Roofing Systems in Florida: Field and Laboratory Results," Thermal Performance of the Exterior Envelopes of Buildings VI, p. 489, December 4 - 8, 1995, Clearwater, FL.
Sonderegger, R.C., 1978. "Movers and Stayers: The Resident's Contribution to Variation Across Houses in Energy Consumption for Space Heating," Energy and Buildings, Vol. 1, No. 3, Elsevier Sequoia, Netherlands.
SRC, 1992. Electricity Conservation and Energy Efficiency in Florida: 1960-1972, SRC Report No. 7777-R3, Florida Energy Committee, Tallahassee, FL.
Stern, P. ed., 1985.Energy Efficiency in Buildings: Behavioral Issues, National Research Council, National Academy Press, Washington D.C.
1. 1 The 190 homes, varying in conditioned floor area from 90 - 140 m2 (1,000 - 1,500 ft2), will feature a battery of energy-efficiency measures recommended in a comprehensive study for the Hurricane Andrew relief effort in 1992 (Parker et al., 1992; 1994). The homes will also stress light-colored exterior surfaces and extensive landscaping as part of EPA's Cool Communities program.
2. 2 Internal appliance energy use is also a significant factor when the analysis is confined to the summer months
3. 3 This may have some bearing on the advisability of providing cooling systems to Habitat homes, currently an issue of considerable debate. Such high temperatures not only threaten health of the elderly, but also encourage consumer purchase of used or low efficiency window units
4. 4 Several of the interviewed homeowners indicated that they ran their single ceiling fan 24 hours a day year around. This suggests the need for education of homeowners regarding proper use of ceiling fans to provide comfort without unnecessary consumption. The electrical demand of typical ceiling fans varies from 20-80 Watts depending on the speed selected, resulting in a consumption of 0.5-1.9 kWh/Day if run continuously.
© 2007-2014 University of Central Florida. The Florida Solar Energy Center (FSEC)
is a research institute of the
University of Central Florida.
For more information about FSEC, please contact us or learn more about us.
Find us on Facebook!