

Reference Publication: Parker, D.S., J. R. Sherwin and M. T. Anello, January 2001. "FPC Residential Monitoring Project: New Technology Development - Radiant Barrier Pilot Project," Contract Report FSEC-CR-1231-01 , Florida Solar Energy Center, Cocoa, Florida. Disclaimer: The views and opinions expressed in this article are solely those of the authors and are not intended to represent the views and opinions of the Florida Solar Energy Center. |
FPC
Residential Monitoring Project: New Technology
Development - Radiant Barrier Pilot Project
D.S.
Parker, J. R. Sherwin and
M. T. Anello
Florida
Solar Energy Center (FSEC)
FSEC-CR-1231-01
Executive Summary
The FPC Monitoring project has evaluated radiant barrier systems (RBS) as a new potential DSM program. The objective was to examine how the retrofit of attic radiant barriers can be expected to alter FPC residential space conditioning loads. An RBS consists of a layer of aluminum foil fastened to roof decking or roof trusses to block radiant heat transfer between the hot roof surface and the attic below. The radiant barrier can significantly lower summer heat transfer to the attic insulation and to the cooling duct system. Both of these mechanisms have strong potential impacts on cooling energy use as illustrated in Figures E-1 and E-2.
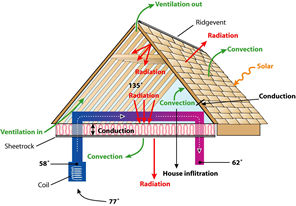
Figure E-1. Heat transfer mechanisms for standard vented attic.
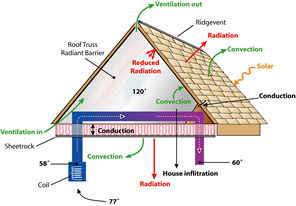
Figure E-2. Altered attic heat transfer mechanisms due to RBS.
The pilot project involved installation of RBS in nine homes which had been extensively monitored over the preceding year. The houses varied in conditioned floor area from 939 to 2,440 square feet; attic insulation varied from R-9 to R-30. The homes had shingle roofs with varying degrees of attic ventilation. The radiant barriers were installed during the summer of 2000 (Figures E-3 and E-4). The first was installed on June 22nd and the last was installed on September 16th. One home, the last installation, was excluded from the analysis due to its late application date which left too little summer data to perform a reliable estimate.
Figure E-3. Site #199 pre retrofit. Note attic air handler.
Figure E-4. Site #199 after RBS application.
Data analysis on the pre and post cooling and heating consumption was used to determine impacts on energy use and peak demand for the utility. The pre and post periods were carefully matched so that time periods evaluated and outdoor air temperatures were nearly identical. Based on the performance at the individual sites, we performed an overall evaluation of the savings from the radiant barrier systems by preparing a composite load profile for the average of the eight site sites.
The average cooling energy savings from the RBS retrofit was 3.6 kWh/day, or about 9%. The average reduction in summer afternoon peak demand was 420 watts (or about 16%). The aggregate load profile for all eight sites pre and post RBS installation is shown in Figure E-5. There was an average 8 degree drop in the average maximum daily summer attic temperature. Reductions on the hottest days were greater. Perhaps more importantly, the measured interior air temperature in the homes averaged over 2oF cooler post RBS retrofit, indicating the application had beneficial impacts to customer comfort.
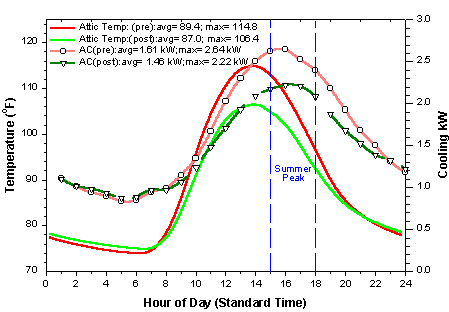
Figure E-5. Composite profiles of RBS impact on sumer attic air temperatures and AC demand in eight monitored sites. Pre-data from summer 1999; post from summer 2000 after installation.
For comparison, we analyzed the influence of higher levels of ceiling
insulation from the summer data taken in the FPC monitoring project.
We compared cooling energy use and demand profiles in a large sample
of homes with R-19 or R-30 attic insulation. Customers with R-30 used
3.4 kWh/day less for cooling than did homes with R-19. However, the
peak demand reduction due to the higher insulation was only 130 Watts
(5%). Although the technologies produce roughly the same energy savings
for the customer, the RBS resulted in a peak reduction three times
greater than added insulation. We hypothesize this is partly due to
reduced heat gains to the duct system in the attic and also because
radiation potential between roof and attic is greatest during peak
cooling demand periods.
Analysis of winter data collected in 2001 showed small benefits of
the RBS to reducing space heat demand during the morning peak demand
period. This occurs because the RBS do not allow the attic to become
as cold during winter nights (lower radiative losses to the night sky).
Based on our findings, we recommend that radiant barrier systems be considered for homes with shingle roofs both in FPC's Home Energy Improvement program as well as emphasized in FPC's new homes program where installations would be most cost effective.
Objective
The fundamental objective for the second phase of the FPC monitoring
project is to evaluate new potential DSM programs. This report describes
an assessment of a pilot project examining how the retrofit of attic
radiant barrier systems (RBS) can be expected to alter FPC residential
space conditioning loads. The pilot project involved installation of
RBS in nine homes which had been extensively monitored over the preceding
year. Data analysis of the pre and post cooling and heating consumption
was used to determine likely impacts on energy and peak demand for the
utility.
Background on Home
Energy Improvement Program
FPC's Home Energy Improvement (HEI) Program provides a number of incentives
to make improvements for residential customers designed to improve system
load shape, reduce customer costs and improve satisfaction. The current
program elements are:
- Attic insulation upgrade
- Duct testing and repair
- High efficiency heat pumps
- Heat recovery units for water heating
- Dedicated heat pump water heaters
The most recent annual participation
rate is approximately 12,000 customers per year. Savings estimates
for the various program elements are contained in the DSM Plan
for FPC.(1) FPC
is interested in exploring additional potential elements to its
HEI program through its New Technology Development program.
Radiant Barrier Technology
Description
An attic radiant barrier system (RBS) consists
of a layer of aluminum foil placed in an air space
to block radiant heat transfer between the roof surface
and the attic insulation below. An RBS depends on the
surface property of low infrared emissivity to provide
the performance benefit. Proper installation of RBS
is covered in design notes from Florida Solar Energy Center (Fairey,
1984) and from ASTM standard C-1158.
RBS is a mature energy-saving technology having first been evaluated
in the late 1950s (Joy, 1958). Most innovations now are materials related.
For instance, industry has recently begun to manufacture roof plywood
decking with the RBS already adhered to its underside. Although reducing
labor costs for new construction, it has little application to a retrofit
technology. Probably the greatest potential for performance enhancement
comes from proper installation. Roof mounted application is preferred
over horizontal application; the later will significantly degrade in
performance from eventual dust accumulation (Fairey and Beal, 1988;
Levins et al., 1990). Recent work has shown that effective attic ventilation
can significantly improve ceiling flux reductions from radiant barriers
(Parker and Sherwin, 1998). Hageman and Modera (1996) have shown that
radiant barriers can significantly influence heat gains of attic mounted
duct system systems.
Performance Data
from Previous Investigations
Radiant barriers are a well documented means to reduce the rate of
heat transfer through the ceiling of residential buildings (Fairey et
al., 1988). For instance, field measurement of the retrofit of ceiling
insulation from R-11 to R-30 in a test home in Tennessee showed a 16%
drop in the measured cooling energy use (Levins and Karnitz, 1987).
Addition of RBS in these tests also showed a similar level of cooling
energy savings to that of R-30 insulation (16% savings). However, these
measurement were made in a home with the air distribution system in
the crawlspace. Larger savings from the RBS might be expected were the
ducts located in the attic, which is common in homes with slab on grade
construction (Parker et al., 1991; Medina, 1994). Generally, previous
research in the Southeast has shown that roof mounted radiant barriers
can reduce ceiling heat flux by 25 - 50% with annual cooling electricity
savings of 7 - 10% (Fairey et al., 1988, 1989; Wilkes, 1991; Ober, 1991;
Ashley et al., 1994; Parker and Sherwin, 1998). Reduction of peak cooling
loads is generally higher. Added attic ventilation with radiant barriers
substantially improve performance since otherwise convected heat to
the attic is removed by ridge vents (Joy, 1958; Parker and Sherwin,
1998).
Utility Experience
Although isolated field studies abound, the performance of radiant barriers as an effective cooling demand reduction measure remains largely unutilized within utility programs for existing homes. Evaluation of an installed RBS system in a home in South Florida showed a reduction in measured space cooling of 5.5% (Parker et al., 1997), although savings were marred by a daytime thermostat setup. Careful testing of two unoccupied side-by-side centrally air conditioned homes in Gainesville Florida showed an 8% reduction in peak day air conditioning with R-19 ceiling insulation (Fairey et al., 1988).
Radiant barriers should be applicable in most roofing systems particularly
for new construction. However, attic geometry can exact limitations
to homes that can use the technology for retrofit. The requirement to
have an air space for adequate radiant barrier performance and the need
for access will limit the ability to use RBS for homes with very low
slope roofs (poor access) and for those with cathedral ceilings. In
homes with very poor attic access, additional labor costs may make such
applications economically unattractive. Also, test data shows that homes
with composition shingles reach the greatest temperatures; tile roofs
experience less attic heating and thus would likely produce less benefits
from an RBS (Beal and Chandra, 1995; Parker and Sherwin, 1998). In the
FPC statistical sample, some 17 homes or 10% had tile roofs. Finally
homes with moderate to extensive roof shading would not likely benefit
from RBS installation. In the base sample, some 54 homes or 32%, had
roof shading (Parker et al., 2000). Thus, based on the aforementioned
factors, perhaps half of existing homes in the Central Florida area
could feasibly have an RBS installed.
RBS Pilot Project
In spring 2000, FPC recruited homes for the RBS pilot project from the existing list of Central Florida home owners that were participating in its residential monitoring project. Qualifying homes had to have asphalt shingle roofs which are not shaded by surrounding landscape and have some attic access. We required qualifying candidates to have operating RTD attic temperature sensors so that attic temperature profiles could be tracked.
All of the homes had asphalt or fiberglass composition shingle roofs of various colors. As typical of homes in Central Florida, all of the test sites had attic located duct systems which were either all R-6 flex duct or a combination of R-4 duct-board and R-4 to R-6 flex. Ducts systems may have important interactions with radiant barriers since reduction to attic heat load can reduce heat gain to the cooling duct system (Hageman and Modera, 1996). None of the homes had whole house fans or attic exhaust fans although a number had attic power ventilators. These operate by a thermostat to come on at approximately 105oF and draw about 200 W each.
A total of nine homes were selected for the project and had radiant barriers installed during the summer of 2000. The RBS system used was a multi-layer foil faced material, Silver Shield, manufactured by the Fi-Foil Company in Audurndale, FL. The material has a tested long-wave emittance of 0.03 - 0.05.(2). The first RBS was installed on June 22nd and the last was installed on September 16th. A summary of the selected characteristics on the homes is contained in Table 1. The houses varied in conditioned floor area from 939 to 2,440 square feet. Attic insulation varied from R-9 to R-30 at the homes.
Table 1. Summary Characteristics of Radiant Barrier System Pilot Project Participants.
| Site | (#199) | (#107) | (#147) | (#72) | (#126) | (#10) | (#155) | (#88) | (#180) |
| Site Location | Largo | New Pt Richey | Tarpon Springs | Orlando | Orlando | Apopka | Orlando | Winter Springs | Orlando |
| Cond. Space Ft2 | 2192 | 1519 | 1520 | 2142 | 2440 | 1845 | 939 | 2115 | 1790 |
| House Age | 1980 | 1979 | 1989 | 1994 | 1987 | 1984 | 1975 | 1989 | 1991 |
| Attic Insulation /Ft2 | 2192-R19 | 1519 - R12 | 1545 - R30 | 2142 - R30 | 2440-R19 | 1946- R30 | 939-R9 | 2287-R19 | 1913-R19 |
| Attic Insulation/Ft2 | NA | NA | 125 - R19 | 140 - R19 | NA | NA | NA | NA | NA |
| Cool System Tons | 2.5 | 2.5 | 2.5 | 4 | 3 | 3 | 2 | 3.5 | 3 |
| Cool System EER | Na | 10 | 9.5 | 10 | 8.5 | 7 | NA | 9 | 9.5 |
| Shingle Color | Brown | Med. Grey | Dark Brown | Grey | Grey | Brown | Light Grey | Grey | Dark Grey |
| AHU Location | Attic | Attic | Attic | Garage | Interior | Garage | Interior | Attic | Garage |
| Continuous Soffit? | Yes | No | Yes | Yes | Yes | Yes | Yes | Yes | Yes |
| Ridge Vent? | No | No | Yes | Yes | Yes | Yes | No | Yes | No |
| Gable Vent? | Yes | Yes | Yes | No | Yes | Yes | Yes | Yes | No |
| Turbine Vent? | No | Yes | No | No | No | No | Yes | No | No |
| Power Vent? | No | No | No | Yes | No | No | Yes | No | No |
| Insulation Void? | No | No | No | No | No | No | Yes | No | No |
| Insulation Type | Blown Fbgl | Rockwool | Batts Fbgl | Blown Fbgl | Blown Fbgl | Batts/Blown | Blown Fbgl | Batt/Blown | Blown |
| Knee Walls? | Yes | No | Yes | Yes | Yes | Yes | No | Yes | Yes |
| RBS Install Date | 6/22/00 | 6/26/00 | 7/20/00 | 7/21/00 | 7/28/00 | 8/4/00 | 8/31/00 | 9/7/00 | 9/16/00 |
Analysis Methods
We have evaluated the savings for each individual installation using a matched weather data comparison. The analysis of the period post RBS installation in 2000 was matched with similar time periods during 1999 with nearly identical average outdoor temperatures. This method was used with the proviso that the average temperature profile in the two periods must match within 0.5oF. This method has the advantage of using long-term weather periods. Its disadvantage is that any changes in thermostat setting, construction or lifestyle over the year will be included in the results.
Site #199
The first test site (#199) was a 2200 square foot home built in 1980 and located in Largo, Florida (Figure 1). It was occupied by a family of three. The roof has a 5/12 pitch with dark brown shingles. Since dark brown shingles have been shown to have a solar absorptance of greater than 90% (Parker et al., 2000), there is considerable potential for producing high attic temperatures during summer months. A portion of the south facing part of the roof is covered by a solar pool heater.
Figure 1. Site #199 from the front (West).
Cooling is provided by a 2.5-ton heat pump with an attic mounted air handler unit (AHU). The RBS was installed on June 22, 2000. The home has R-19 ceiling insulation under a brown asphalt shingle roof (Figure 2).
Figure 2. Site #199 attic shows insulation and ducts.
The attic air handler could be expected to influence results since any return leakage into the cabinet or heat transfer to the evaporator section would be influenced by the prevailing attic thermal conditions (Figure 3).
Figure 3. Site #199 showing attic air handler prior to retrofit.
Prior to the RBS installation, the site had a measured space cooling consumption of 9,189 kWh (4.19 kWh/ft2) in 1999 (compared with a system-wide average of 5,646 kWh). The site had very little recorded consumption for space heating - only 68 kWh in 1999 - largely due to the occupants being willing to tolerate low interior temperatures without heating.(3)
Figure 4 show the attic after the RBS was installed on June 22, 2000. As shown by the attic temperature history, the peak summer attic temperatures were reduced by about 15oF (Figure 5).
Figure 4. Site #199 after RBS retrofit.
Figure 5. Site #199 attic temperature history before and after
retrofit on June 22, 2000 (Julian day 174).
Using periods with very similar average temperatures in 1999 and 2000, the RBS showed a reduction in cooling energy use of 19.7% (10.6 kWh/day). The average daily peak attic air temperature was reduced by 12.2oF. The reduction in peak cooling demand was 19% or 1.10 kW.
It is noteworthy that the occupants mentioned that interior comfort had been considerably improved which may have lead to a change in thermostat preference. Site #199 maintained a one degree cooler average temperature after the RBS retrofit. The alteration of the load profile is shown in Figure 6. The long-term weather-matched time periods extended from June 15 - October 16 of 1999 and June 25 - September 26 of 2000.
Figure 6. Site #199 RBS retrofit impact on attic air temperatures
and AC cooling demand.
Site #107
The second RBS retrofit site was a 1,520 square foot home built in 1979 and located in New Port Richey (Figure 7). It was occupied by a single middle aged woman; her preferred summer and winter temperatures were 78 and 65oF, respectively.
Figure 7. Front view of site #107 (north).
The 3/12 pitch roof also has medium gray composition shingles with the air handler located in the attic. There is no appreciable landscape shading although the home has two turbine attic vents. As with the first site, the attic location of the air handler was expected to yield additional savings. The home is conditioned by a 2.5-ton air conditioner with 10 kW of electric resistance strip heat. The ceiling insulation at this site is poor (R-12) as evidenced by the low insulation thickness. Measured annual space cooling in 1999 was 4,293 kWh (2.83 kWh/ft2); space heating in the same year totaled 1,200 kWh (0.79 kWh/ft2).
Figure 8. Attic ducts at Site #107.
Figure 9. Blown R-12 fiberglass attic insulation at Site #107.
The RBS was installed on June 26th, 2000. The attic temperature history is shown in Figure 10. Using periods with very similar average temperatures in 1999 and 2000, the RBS showed a reduction in cooling energy use of 11.3% (2.9 kWh/day). The peak attic air temperature was reduced by 16.5oF. The reduction in peak cooling demand was 10% or 0.17 kW. The alteration of the load profile is shown in Figure 11. The long-term time periods extend from June 1 - October 2 of 1999 and June 6 - September 26 of 2000.
Figure 10. Site #107 attic temperature history before and
after retrofit on June 26, 2000 (Julian day 178).
Figure 11. Site #107 RBS retrofit impact on attic air temperatures
and AC cooling demand.
Site #147
The third RBS retrofit site was a newer 1,520 square foot home built in 1989 and located in Tarpon Springs (Figure 12). It was occupied by an older couple who profess a preference for warmer temperatures in summer.
Figure 12. Site #147 front view (Northeast).
The 5/12 pitch roof also has dark brown composition shingles with the air handler located in the attic. There is appreciable tree shading of the southeast and north-west exposures. As with other such sites, we would be expect the attic air handler location to yield additional savings. However, the ceiling insulation at this site consists of thick un-faced fiberglass batts (R-30) as shown in Figure 13. The home is conditioned by a 2.5-ton heat pump with 5 kW of supplemental strip heat. Measured annual space cooling in 1999 was 2,475 kWh (1.63 kWh/ft2); space heating in the same year totaled 476 kWh (0.31 kWh/ft2).
Figure 13. R-30 batt attic insulation at Site #147.
The RBS was installed on July 20th, 2000 (Figure 14). The attic temperature history is shown in Figure 15.
Figure 14. RBS installation at Site #147.
Figure 15. Site #147 attic temperature history
before and
after retrofit on Julyu 20, 2000 (Julian day 202).
Using periods with very similar average temperatures in 1999 and 2000, the RBS showed a reduction in cooling energy use of 16.0% (2.6 kWh/day). The peak attic air temperature was reduced by 21.5oF. The reduction in peak cooling demand was 24.8% or 0.36 kW. The alteration of the load profile and attic temperatures is shown in Figure 16. The long-term time periods extend from July 21 - September 30 of 1999 and July 21 - September 30 of 2000.

Figure 16. Site #147 RBS retrofit impact on attic air temperatures
and AC cooling demand.
Site #72
The fourth RBS retrofit site was a newer 2,140 square foot home built in 1994 and located in Orlando. It was occupied by a family of three who like to maintain 77oF in summer and only infrequently use their heating system.

Figure 17. Front view of Site #72 (East).
The 6/12 pitch roof also has dark brown composition shingles. Unlike the previous sites, the air handler is not located in the attic, but in the garage. With the large roof pitch, the attic has a large volume; it is also forced ventilated by a four power ventilators which typically activate when the attic reaches 105oF. There is a small amount of tree shading of the southern and northern exposures. However, the ceiling insulation at this site appeared excellent on inspection; it consists of very thick and uniform blown fiberglass (R-30) as shown in Figure 18. The ducts are largely buried in the insulation. Along with the non-attic air handler, large attic volume and ventilation and good ceiling insulation, this should lead to relatively less impact from the radiant barrier. The home is conditioned by a 4-ton heat pump with 5 kW of supplemental strip heat. Measured annual space cooling in 1999 was 6,283 kWh (2.94 kWh/ft2); space heating in the same year totaled 650 kWh (0.30 kWh/ft2).
Figure 18. Excellent R-30 ceiling insulation at Site #72.
The RBS was installed on July 21th, 2000 (Figure
19). The attic temperature history is shown in Figure
20.

Figure 19. Roof truss mounted RBS

Figure 20. Site #72 attic temperature history before and
after retrofit on July 21, 2000 (Julian day 203).
Using identical time periods with very similar average outdoor temperatures in 1999 and 2000, the RBS showed no reduction or real change in cooling energy use. The peak attic air temperature was reduced by 3.1oF - only a slight drop. There was also no reduction to peak cooling demand, which increased insignificantly by 0.07 kW. The alteration of the load profile and attic temperatures is shown in Figure 21. The long-term time periods matched weather extend from May 22 - October 1 of 1999 in the pre-period and July 25 - September 15th of 2000.
Figure 21. Site #72 RBS retrofit impact on attic air temperatures
and AC cooling demand.
The lack of savings at Site #72 was largely due to a 1oF lower thermostat set temperature in the post period data taken a year later. This is clearly illustrated by the averages plotted in Figure 22.
Figure 22. One degree lower interior set point maintained
after RBS retofit at Site #72 erased potential savings.
This site was incorporated into the overall project results, since thermostat "take back" reflects real world variation in customer behavior associated with residential DSM programs.
Site #126
The fifth RBS retrofit site was a 2,440 square foot home built in 1987 and located in Orlando (Figure 23). It was occupied by an older couple who profess a preference for cooler temperatures in summer. They indicate they leave the thermostat set to 73oF year round.
Figure 23. Site #126 from front (South).
The 4/12 pitch roof has gray composition shingles. The air handler is located on the home interior. There is little landscape shading of the property. The ceiling insulation consists of blown fiberglass (R-19) as shown in Figure 24 but is not evenly distributed. The home is conditioned by a 3-ton air conditioner with natural gas heating. Likely due to the low temperature preference, measured annual space cooling in 1999 was high: 10,787 kWh (4.42 kWh/ft2); space heating electrical use for the furnace air handler in the same year was 370 kWh (0.15 kWh/ft2).(4)
Figure 24. Uneven R-19 ceiling insulation at Site #126.
The RBS was installed on July 28th, 2000. The attic temperature history is shown in Figure 25.
Figure 25. Site #126 attic temperature history before and
after retrofit on July 28, 2000 (Julian day 210).
Using identical time periods with very similar average temperatures in 1999 and 2000, the RBS retrofit showed a very large reduction in cooling energy use of 27.2% (17.8 kWh/day). The peak attic air temperature was reduced by 15.6oF. The reduction in peak cooling demand was 26.6% or 1.11 kW. Examination of interior temperatures maintained from one year to the next showed that part of the reduction was due to an slightly elevated interior temperature in the post period. We speculate that the large savings are due to the relatively poor quality of the ceiling insulation and the change in thermostat setting. The alteration of the load profile and attic temperatures is shown in Figure 26. The long-term time periods extend from July 30 - Sept. 30 of 1999 and July 30 - Sept. 30 of 2000.
Figure 26. Site #126 RBS retrofit impact on attic air temperatures
and AC cooling demand.
The sixth RBS retrofit site was a 1,840 square foot home built in 1984 and located in Apopka (Figure 27). It was occupied by an older couple who prefer 77oF in summer and 71oF in winter.
Figure 27. Site #10 from front (South).
The 4/12 pitch roof has dark brown composition shingles. The air handler is located in the garage. However, there is some tree shading of the property including portions of the roof (Figure 27) which could be expected to reduce the savings of the RBS. The attic is also well vented with continuous soffit, ridge vents and temperature controlled power vents (Figure 28).
Figure 28. New roof at Site #10 from rear.
Figure 29. Power vent and off-ridge vents at Site #10.
The ceiling insulation consists of 10-inch fiberglass batts (R-30) as shown in Figure 30 but is not evenly distributed. The home is conditioned by a 3-ton heat pump with 5 kW of supplemental strip heat. Annual space cooling in 1999 was 8,263 kWh (4.48 kWh/ft2); space heating in the same year was 1,603 kWh (0.87 kWh/ft2).
Figure 30. Site #10 ducts and attic insulation; note off-ridge
vent in decking.
The RBS was installed on August 4th, 2000. The attic temperature history is shown in Figure 31.
Figure 31. Site #10 attic temperature history before and after retrofit on August 4, 2000(Julian day 217).
Using identical time periods with similar average temperatures in 1999 and 2000, the RBS showed a reduction in cooling energy use of 5.3% (2.4 kWh/day). The peak attic air temperature was reduced by 11.4oF. The reduction in peak cooling demand was 10.8% or 0.30 kW. The alteration of the load profile and attic temperatures is shown in Figure 32. The long-term time period used for the evaluations extend from August 5 - September 30 of 1999 and the same time period for 2000.
The seventh RBS retrofit site was a small 939 square foot home built in 1975 and located in Orlando. It is occupied by two adults who prefer 72oF in during the day and 78oF at night. They indicate a preference for 72oF in winter.
Figure 32. Site #10 RBS retrofit impact on attic air temperatures
and AC cooling demand.
The 4/12 pitch roof has light grey composition shingles. The air handler is located in the interior. However, there is some tree shading of the property including portions of the roof (see Figure 33) which could be expected to reduce the savings of the RBS. The attic is also well vented with continuous soffit, turbine vents and temperature controlled power vents.
Figure 33. Site #155 from rear (East). Note tree shade.
The ceiling insulation is poor, consisting of 3-inches of blown (R-9) which is unevenly distributed as shown in Figure 34. Several voids were noted in the audit. The home is conditioned by a 2-ton air conditioner. It is heated by 10 kW of electric resistance strip heat. Annual space cooling in 1999 was 4,420 kWh (4.71 kWh/ft2); space heating in the same year was 810 kWh (0.86 kWh/ft2).
Figure 34. Site #155 showing attic insulation.
The RBS was installed on August 31st, 2000. The attic temperature is shown in Figure 35.
Figure 35. Site #155 attic temperature history before and
after retrofit on
August 21, 2000 (Julian day 244). Note minimal
change to attic temperatures.
This site, along with the remaining two, had savings which were influenced by the late time in the season in which the RBS was installed. Even so, using identical time periods with similar average temperatures in 1999 and 2000, the RBS showed a reduction in cooling energy use of 8.4% (1.7 kWh/day). The peak attic air temperature was reduced by 3.0oF. The reduction in peak cooling demand was 8.5% or 0.14 kW. The alteration of the load profile and attic temperatures is shown in Figure 36. The long-term time data used for the evaluations extends from September 1 - September 30 of 1999 and the same time period for 2000.
Figure 36. Site #155 RBS retrofit impact on attic air temperatures
and AC cooling demand.
The eighth RBS retrofit site was a 2,115 square foot home built in 1989 and located in Winter Springs. It was occupied by two adults who prefer it very cool in summer (70oF) and claim to heat sparingly.
The 4/12 pitch roof has medium gray composition shingles. The air handler is located in the attic. There is little tree shading of the property (Figures 38 and 39) The very dark roof and attic air handler could be expected to increase RBS savings. The attic is also well vented with continuous soffit, turbine vents and temperature controlled power vents.
Figure 38. Site #88 from front (East).
Figure 39. Site #88 from rear.
The ceiling insulation is typical, consisting of 6-inches of blown fiberglass (R-19) although unevenly distributed as shown in Figure 37. The home is conditioned by a 3.5-ton heat pump with 10 kW of supplemental strip heat. Annual space cooling in 1999 was 7,817 kWh (3.70 kWh/ft2); space heating in the same year was 313 kWh (1.57 kWh/ft2). Space heat was elevated since the heat pump was not functioning in heating mode and operated exclusively with the heat pump's supplemental 10 kW strip heat.
Figure 37. Site #88 attic with installed ducts and air handler.
R-19 insulation.
The RBS was installed on September 7th, 2000. The attic temperature history pre and post retrofit is shown in Figure 40.
Figure40. Site #88 attic temperature history before and
after retrofit on September 7, 2000 (Julian day 251).
This site had savings which were influenced by the late time in the season in which the RBS was installed. The late installation also considerably limited the available period of comparison to only the last three weeks of September in 2000. However larger than the influence of the RBS was the fact that the household reduced their cooling thermostat set temperature one week after the installation of the RBS by approximately 2oF. This more than negated any potential savings (and may be considered another case of "take-back"). As seen in Figure 41, this particular home has frequent changes to the thermostat setting which exert a large influence on cooling. This is likely to strongly impact any savings from the RBS retorfit.
Figure 41. Site #88 showing change in thermostat set temperature after RBS retrofit.
Nonetheless, since the idea within the pilot project was to consider "real world" performance it was included in the analysis.Using identical time periods with similar average outdoor temperatures in 1999 and 2000, the post RBS retrofit showed a increase in cooling energy use of 8.4% (1.7 kWh/day). There was also little observed impact on the peak attic air temperature. The reduction in peak cooling demand was 8.5% or 0.14 kW. The alteration of the load profile and attic temperatures is shown in Figure 42. The long-term time period used for the evaluations extend from September 8 - September 30 of 1999 and the same time period for 2000.
Figure 42. Site #88 RBS retrofit impact on attic air temperatures
and AC
cooling demand. Note absence of savings largely due to thermostat
"take back".
Due to the late installation, this site should be re-examined in the summer of 2001 to see if savings can be observed. The conclusions reached here may not be valid due to the lateness of the installation.
The ninth and final RBS retrofit site was a 1,790 square foot home built in 1991 and located in Orlando (Figure 43). It was occupied by a family of three. The household prefer 78oF in during the summer. They indicate a preference for 70oF on winter nights and 67 otherwise.
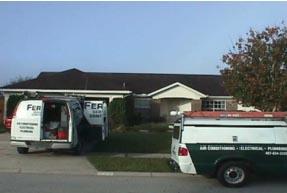
Figure 43. Site #180 from front (East).
The 4/12 pitch roof has dark grey composition shingles. The air handler is located in the interior. The attic is typically vented with continuous soffit and three off-ridge bents. The ceiling insulation is good, consists of 6-inches of blown fiberglass (R-19) which is very evenly distributed as shown in Figure 44. The home is conditioned by a 3-ton heat pump with 5 kW of supplemental strip heat. Annual space cooling in 1999 was 5,903 kWh (3.30 kWh/ft2); space heating in the same year was 737 kWh (0.41 kWh/ft2).
Figure 44. Site #180 shows excellent quality blown R-19
insulation.
The RBS was installed on September 16th, 2000. The attic temperature history is shown in Figure 45.
Figure 45. Site #180 attic temperature history before and
after retrofit on September 16, 2000 (Julian day 260).
This site observed savings were likely influenced by the late time in the season in which the RBS was installed. Using identical time periods with similar average temperatures in 1999 and 2000, the RBS showed no reduction in cooling energy use. Part of this may be to a lower interior temperature during nighttime hours during the post period. Cooling use increased by of 4.5% (1.4 kWh/day). However, the peak attic air temperature was reduced by 3.9oF. The reduction in peak cooling demand was negligible and within the error limit of estimation: 1.4% or 0.02 kW. The alteration of the load profile and attic temperatures is shown in Figure 46. The long-term time period used for the evaluations extend from September 17 - October 17 of 1999 and the same time period for 2000.

Figure 46. Site #180 RBS retrofit impact on attic air temperatures
and AC
cooling demand. Short monitoring period likely influences
results in a negative fashion.
As with Site #88, due to the late installation, this site should be re-examined in the summer of 2001 to see if savings are observed. The conclusions reached here may not be valid due to the late summer data used for the evaluation. As such, we excluded this site from our overall evaluation of RBS performance.
Overall Results
Savings ranged from a high of 27% (Site #126) to negative savings ("take back") at Site #88. The highest savings came from RBS installations with attic air handlers. There were also no indicated savings at Site #180 due to problems with the analysis from the late RBS installation.
Based on the performance at the individual sites, we performed an overall evaluation of the savings from the radiant barrier systems installed during the summer. This was done by preparing a composite load profile for the average of all eight sites shown in Figure 47. We excluded Site #180 since it would have likely yielded a cooling energy reduction had the RBS retrofits been performed earlier in the summer.
Figure 47. Composite profiles of RBS impact on summer attic
air temperatures and AC demand
in eight monitored sites. Pre-data
from summer 1999; post from summer 2000 after installation.
The average cooling energy savings amounted to 3.6 kWh/day (9.3%). The mean reduction in peak demand was 420 watts (or about 16.0%).(5) The aggregate load profile for all eight evaluated sites pre and post RBS installation is shown in Figure 47. There was an average 8.4o drop in the peak daily summer attic temperature. Note that loads are slightly increased at night (an RBS does not allow the attic to cool off as readily as the circumstance without), but reductions are strongly concentrated during the utility summer peak demand period.
Figure 48 compares the excellent outdoor temperature match between the composite analysis for the pre RBS and post RBS periods. The second plot on the graph shows the improved indoor temperature condition post retrofit as well as some evidence at night of slightly lower thermostat set points.
Figure 48. Comparison of average outdoor and indoor
temperature
profiles match in the pre and post period.
Comparison with Added Ceiling Insulation
The FPC data also indicate larger summer peak reductions from the RBS than from added insulation. As shown in Figure 49, changing from R-19 to R-30 produces an average daily cooling load reduction of 3.4 kWh - just slightly lower than the average energy savings produced by the RBS. However, the demand reduction from the RBS (Figure 49) are concentrated during the summer utility peak period.
Figure 49. Impact of ceiling insulation on summer cooling
demand
in the FPC monitoring sites (June 21 - Sept. 30, 1999).
The average peak reduction from the RBS (420 Watts) was three times a great as that produced by added insulation. That data showed that R-30 (n=35) vs. R-19 (n= 43) insulation produced a 3.4 kWh/day savings (11%) with a peak demand reduction of 130 Watts (6%). We speculate the higher peak savings from the RBS was due to reduced heat gains to the attic duct system and also because radiation potential between roof and attic is greatest during peak cooling demand periods.
Winter Performance
RBS mainly impact cooling, but should produce some beneficial peak heating demand reduction. This happens since the RBS retards the rate at which the roof radiates heat to the night sky and results in warmer attic temperatures during the night hours and during the critical morning winter peak period. Slightly lower mid-day attic temperatures will be produced by the RBS. However, most heating in Central Florida takes place during the early morning and during the evening and not during the middle of the day when the RBS reduces attic temperatures.
In previous work a detailed simulation analysis by Oak Ridge National Laboratory showed space heating reductions in Miami, Orlando and Atlanta (Wilkes, 1991). Also, detailed measurements by ORNL showed heating demand and energy reductions in monitored Tennessee homes (Levins and Karnitz, 1987).
We performed a rough comparison by comparing two winter days pre and post RBS installation that had similar minimum temperatures during the peak morning period. Figure 50 shows the comparative outdoor temperatures on the two days.
Figure 50. Match of outdoor temperature on winter comparison
days.
Pre: January 6, 1999; Post: January 6, 2001. Note correspondence
during peak.
The lower total daily space heating energy use with the RBS is not meaningful due to differences in the afternoon outdoor temperatures. However, the reduced space heat demand during the peak winter period does provide a useful comparison since the temperature match was quite good.
The elevation of the attic temperature at night due to the RBS can clearly be seen in Figure 53. The figure plots average heating demand and attic conditions for the five houses which had the radiant barrier installed and were heating on the comparison days. Note that the attic temperature is 2oF warmer at 6 AM in the post RBS retrofit period than it was in the pre period. The line crosses over at 10 AM, with the RBS attic colder between noon and 6 PM. This is not a problem, however, as little heating occurs in Florida during warmer mid-day hours.
Figure 51. Heating load and attic temperature profiles
for five RBS sites, pre (January 6, 1999)
and post retrofit (January
5, 2001). Note warmer attic nighttime and early morning
temperatures
with RBS during peak period. Attic temperature is only lower with
RBs at mid-day.
Economics
An installed radiant barrier in new residential construction costs approximately $0.15 - $0.35/square of roof area. This cost was estimated through contacts with several vendors in Florida and Texas (Parker et al., 1991; Medina et al., 1994). Since FPC homes average 1,600 square feet and likely have roofs averaging about 2,000 square feet, this results in an incremental cost range of $300 - $750. Foil laminated-roof decking materials make up the low end of this cost range.
The cost for retrofit in existing homes is highly variable, but may average $0.50 - $0.75 per square foot due to increased installation labor. The range of the costs is also in general agreement with the costs encountered in a residential retrofit program in Oklahoma (Ternes and Levins, 1992).
As seen from our data, average reductions to space cooling
energy were about 9%. Individual savings should depend on pre-existing
ceiling insulation, duct and air handler location and roof to
floor area ratio. For a typical FPC customer using 5,650 kWh
per year for cooling, this would represent an average annual
savings of about $41. Since space heating energy savings are
lower, the economics of RBS will be greatest for customers with
high summer utility bills. Because of lower installation costs,
economics will look best in new homes.
Recommendation
Radiant barriers should receive consideration for
inclusion in FPC's Home Energy Improvement program. The recommendation
based on superior savings potential relative to added ceiling insulation
and over three times the impact on peak cooling loads. Emphasis
within FPC's new homes program should receive special attention
due to more attractive economics. Energy and demand savings are
largest in households with lower ceiling insulation levels and
those with attic-mounted air handlers.
Acknowledgments
Special
thanks to Bill Lippy and Gene Basshum at Fi-Foil,
Inc. for providing the radiant barrier systems evaluated
in the study. Tom Daniel with Daniel Insulation and
Jim Hardin with Gale Insulation performed the RBS applications.
Katie Richardson at FSEC helped with some of the early data analysis
and Wanda Dutton prepared the project report. Finally, our appreciation
also to the FPC customers who agreed to participate in the pilot
project.
References
Ashley, R., Garcia, O., Medina, M.A. and Turner, W.D., 1994. "The Effect of Radiant Barrier Technology on Summer Attic Heat Load in South Texas," Proceedings of the Ninth Symposium on Improving Building Systems in Hot and Humid Climates, Arlington, TX.
Fairey, P. Swami, M. and Beal, D., 1988. Radiant Barrier Systems Technology: Task 3 Report, Florida Solar Energy Center, FSEC-CR-211-88, Cape Canaveral, FL.
Fairey, P., 1984. "Designing and Installing Radiant Barrier Systems," Florida Solar Energy Center, FSEC-DN-7-84, Cape Canaveral, FL.
Hageman, R. and Modera, M.P., 1996. "Energy Savings and HVAC Capacity Implications of a Low- Emissivity Interior Surface for Roof Sheathing," Proceedings of the 1996 Summer Study on Energy Efficiency in Buildings, American Council for an Energy Efficient Economy, Washington D.C., Vol. 1, p. 117.
Joy, F.A., 1958. "Improving Attic Space Insulation Values," ASHRAE Transactions, Vol. 64, 1958.
Levins, W. P. and Karnitz, M. A. Cooling Energy Measurements of Single-Family Houses with Attics Containing Radiant Barriers in Combination with R-11 and R-30 Insulation, ORNL/CON-226, Oak Ridge National Laboratories, Oak Ridge, TN.
Levins, W. P. and Karnitz, M. A. and Hall, J.A., 1990. Cooling Season Energy Measurements of Dust and Ventilation Effects on Radiant Barriers, ORNL/CON-271, Oak Ridge National Laboratories, Oak Ridge, TN.
W.P. Levins and M.A. Karnitz, Heating Energy Measurements of Unoccupied Single Family Homes with Attics Containing Radiant Barriers, ORNL/CON-213, Oak Ridge, TN, Jan, 1987.
Medina, M.A., Turner, W.D. and O'Neal, D.L., 1994. "Economic Evaluation of Insulation/Radiant Barrier Systems for the State of Texas," Proceedings of the Ninth Symposium on Improving Building Systems in Hot and Humid Climates, Arlington, TX.
Ober, D.G. Attic Insulation Performance: Full Scale Tests of Conventional Insulation and Radiant Barriers, Mineral Insulation Manufacturer's Association, Final Report, Denver, CO, July, 1990.
Parker, D., Barkaszi, S., Beal, D, McIlvaine, J.and Anello, M.T., 2000. Laboratory Testing of the Reflectance Properties of Roofing Materials, FSEC-CR-670-93(revised), Florida Solar Energy Center, Cocoa, FL.
Parker, D.S., Fairey, P. and Gu, L., 1993. "Simulation of the Effects of Duct Leakage and Heat Transfer on Residential Space Cooling Energy Use," Energy and Buildings, #20, Elsevier Sequoia, Netherlands.
Parker, D., Sonne, J., Barkaszi, S., Floyd, D., and Withers, C., 1997. Measured Energy Savings of a Comprehensive Retrofit in an Existing Florida Residence, FSEC-CR-978-97, Florida Solar Energy Center, Cocoa, FL.
Parker, D. and Sherwin, J., 1998. "Comparative Summer Attic Thermal Performance of Six Roof Constructions,"ASHRAE Transactions, Vol. 108, Pt. 2 , FSEC-PF-338-98, Florida Solar Energy Center, Cocoa, FL.
Parker, D., Anello, M., Kalaghchy, S., Richardson, K. and Sonne, J., 2000. FPC Residential Monitoring Project: Assessment of Direct Load Control and Analysis of Summer Performance: Volume 1, FSEC-CR-1169-00, Florida Solar Energy Center, Cocoa, FL, April, 2000.
Parker, D., Anello, M., Kalaghchy, S., Klongerbo, J., 2000(B). FPC Residential Monitoring Project: Assessment of Direct Load Control and Analysis of Winter Performance, FSEC-CR-1112-99, Florida Solar Energy Center, Cocoa, FL, December, 2000 (revised).
Ternes, M.P. and Levins, W.P. 1992. The Oklahoma Field Test: Air Conditioning Electricity Savings from Standard Energy Conservation Measures, Radiant Barriers and High Efficiency Air Conditioners, ORNL/CON-317, Oak Ridge National Laboratories, Oak Ridge, TN.
Wilkes, K.E. 1991. Analysis of Annual Thermal and Moisture Performance of Radiant Barrier Systems, ORNL/CON-319, Oak Ridge National Laboratories, Oak Ridge, TN.
1. Docket 991789-EG, December 29, 1999.
2. As evaluated by test method ASTM E-408.
3. Recorded indoor temperatures showed that the occupants would allow the temperature to fall to 65oF without activating space heat.
4. This level of space cooling is almost twice the average measured in the monitoring project (5,650 kWh). The site would be an excellent candidate for conversion to a high efficiency heat pump.
5. As described earlier, the RBS at Site #180 was not installed until Sept. 16, 2000, providing insufficient cooling season data upon which to perform a reliable analysis. However, including Site #180 in the analysis, the average space cooling energy savings drops to 8.5% (3.1 kWh/day) and the average peak reduction falls to 380 Watts (15%).
*Prepared
for:
John Masiello
Florida Power Corporation
3300 University Blvd., Suite #158
Winter Park, FL 32972
© 2007-2014 University of Central Florida. The Florida Solar Energy Center (FSEC)
is a research institute of the
University of Central Florida.
For more information about FSEC, please contact us or learn more about us.
Find us on Facebook!