![]()
How Can Home Energy Efficiency Be Improved?
The energy End-Use Rating Scales provided on the Rating Guide (DCA Form 11) give a good indication of the relative efficiencies of the various energy end-uses of a home. In combination with the End-Use Bar Chart on page 1 of the Guide, users have an excellent starting point from which to begin making efficiency improvement decisions. Typically, the rule-of-thumb is simple: the further to the right (worst) end of the scale a rating is, the easier it will be to improve, and conversely, the further to the left (best) end, the harder it will be to improve. However, it is very important to understand that this rule-of-thumb leaves out the critically important consideration of the cost of improvement.
Typical Residential Building Energy Performance
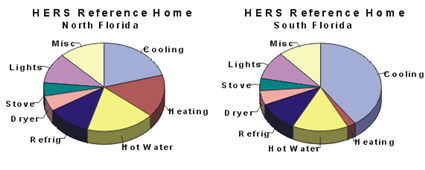
To improve the energy efficiency of a building it is necessary to understand the factors that are affecting its energy use. The energy performance of residential buildings is significantly impacted by the exterior environment. As illustrated below in Figure 1, Florida has a range of outdoor climates that have significant impact on the distribution of energy end-uses in homes. Since every home will have a different distribution, it is necessary to select a specific home for this example. The example uses a 1500 ft2, 3-bedroom home that is configured to be identical to the HERS Reference Home (which is also equivalent to the national MEC minimum standard). Energy end-use comparisons in the extremes of Florida's climates are given in Figure 1 and cooling and heating load source comparisons for central Florida are given below in Figures 2 and 3, respectively.
 |
| Figure 1. Energy end-use pie charts showing the differences in residential building energy end-uses for north and south Florida climate zones. |
|---|
It is clear from the above pie charts that the energy end-uses considered by the HERS Index (heating, cooling and hot water) comprise the majority (55-58%) of total energy use in Florida homes. It is also clear that the significant differences caused by climate derive from the heating and cooling end-uses.
The single largest energy end-use in Florida homes is for cooling. In north Florida it comprises just over 20% of total energy use, and in south Florida it comprises over 40%! Although not shown, the cooling energy use in central Florida is just over 30% and the heating end-use is just under 7% of the total home energy use.
Hot water energy use makes up the next largest segment of the pie, ranging from just under 15% in south Florida to just over 18% in north Florida. This end-use can often be significantly reduced using energy-efficient technologies like solar hot water systems and dedicated heat pumps, and it can be moderately reduced using heat recovery systems.
Although heating energy use can be significant (15% of the total) in north Florida, it drops precipitously to only 2% of total home energy use in south Florida. Lighting and refrigeration are the next largest energy uses with each using about 11% of total home energy use in all climates. These two end-uses are rated by Florida's rating system and significant energy use and cost savings can accrue if their efficiencies are improved beyond the standard used for the HERS Reference Home.
Cooling Load Sources
 Since the largest and most complicated of the above energy end-uses stems
from cooling, it is important to understand the load sources for this end-use
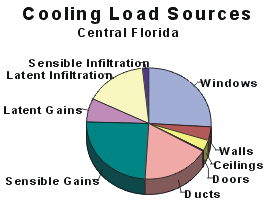
in typical Florida homes. Figure 2 at right gives
the typical sources of cooling loads in central Florida. The home is constructed
with a slab-on-grade floor, which reduces rather than contributing to the
cooling load, so a floor load does not appear on the pie chart. All other
load sources are given in detail. It is interesting to note the distribution
of the latent (moisture) loads given in the example - this distribution is
quite typical of Florida homes, with outdoor air infiltration being by far
the largest contributor to this air conditioning load.
It is also important to understand that the loads given on the left-hand side of the pie chart are by-in-large set by the rating system. In new Florida homes and in the HERS Reference Home the infiltration load is set to 0.35 air changes per hour (ach). This represents the lower limit of the recommendations of ASHRAE(1) and credit for infiltration control below this air change rate is not allowed by the HERS Guidelines. Research on typical Florida residences supports this, showing typical infiltration rates below 0.35 ach.(2) For existing homes, however, energy efficiency credit may be taken down to an infiltration rate of 0.35 if performance testing, accomplished before and after improvements, shows that infiltration rates have been effectively reduced from rates that are originally greater than 0.35 ach. The internal gains given in the pie chart are also set by guidelines. Internal gains are determined solely by the square footage of the home in Florida's rating system and they will not be reduced by changes to any other components of the building or its end-uses.
Therefore, the right-hand side of the pie chart (constituting slightly over half of the cooling loads) represents the only load sources that can be readily improved. Of these, the window and duct loads stand out.
Windows
Windows comprise by far the largest single portion of the cooling load everywhere in Florida. In this example they comprise about 26% of the cooling load. They may be controlled by shading, either by external overhangs or by the physical properties of the glazing used in the window. The thermal insulating property (U-value) of a window has virtually no impact on its ability to control cooling loads in buildings. On the other hand, the shading characteristics of the window have a major impact. This is caused by two facts:
- The cooling load arising from windows derives almost exclusively from solar energy passing through the glass, being absorbed by materials within the home and being transformed into heat that must be removed by the air conditioner, and
- The average daily temperature difference (what the U-value protects against) between the outside and inside of the building is small during the cooling season.
Overhangs, however, are not nearly as effective on the north and south faces of the building because direct sunlight strikes the south facing windows at a very high angle in summer and the large majority is reflected, and there is very little direct sunlight that falls on north facing windows.
The other approach to controlling window cooling loads is to use better windows. An entirely new line of "solar control" windows, explicitly designed for southern climates, is now on the market. These products work by allowing light to enter the window but at the same time keeping heat out. This is possible because over half of the energy content of sunlight is in wavelengths which are not visible to the human eye. Thus, these new marvels of technology have been specifically designed to "selectively" admit only the visible portion of the sunlight that strikes the window. They are referred to as spectrally selective glazing because they admit only the beneficial part (visible light) of the sunlight spectrum.
To determine which window is best, we will define a new term - the "coolness ratio." The coolness ratio is the ratio of the visible light transmittance (VLT) of the window divided by the solar heat gain coefficient (SHGC) of the window. The greater this coolness ratio, the lower the cooling load caused by each unit of window - it's as simple as that. The typical double-glazed, clear windows used in this example have a VLT around 0.57 and an SHGC around 0.61, so they have a coolness ratio around 0.93. The new double-glazed "solar control" (spectrally selective) windows on the market today have a VLT near 0.54, an SHGC near 0.28 and a coolness ratio of about 1.9, meaning that they are twice as efficient during cooling as the more conventional clear, double-glazed windows used in the example home.
Ducts
The rather large duct loads shown by the example stem from the fact that the air conditioning ducts are located in the attic and are leaky - both typical of Florida homes. By far the larger of the impacts arises from the fact that the ducts are leaky. The loads caused by duct leakage stem from two phenomena - the first obvious, the second more cryptic: 1) they waste the cooling that already has been provided by the air conditioner, and 2) they pressurize or depressurize the building, causing the exchange of indoor and outdoor air (infiltration) to double or triple. It is clear from the infiltration loads shown in Figure 2 above that doubling or trebling infiltration will not only have a major impact on cooling loads, but also will result in significant increases in the amount of moisture brought into the building. As a result, homes with extensive duct leakage problems often have difficulty maintaining reasonable relative humidities.
Florida's rating system allows for substantial improvement of duct load impacts. Both the heat gains caused by the insulation value and location of the ducts and the leakiness of the ducts are considered. Since duct leaks cannot be visually identified, Class 1 duct testing is required to confirm that duct systems are "leak free." However, Raters of any class can use ENERGYGAUGE to propose that duct systems be made tight and determine the resulting energy impact. Normally the energy impact is large and well justified by the cost of testing, and repair if necessary.
Walls and Ceilings
The cooling loads coming from the walls and ceilings of the example building are relatively small compared to the window and duct loads. A large part of the reason is that the walls and ceilings in this example already have been insulated to reasonable levels. For example, the ceilings in this example contain R-20 insulation and have reached very near their optimal thermal resistance. The walls exhibit the same phenomena with respect to their insulation levels. Nevertheless, because of the long lifetime and relatively low cost of insulation, it would likely prove cost effective to increase the levels of ceiling insulation somewhat in this example.
Heating Load Sources
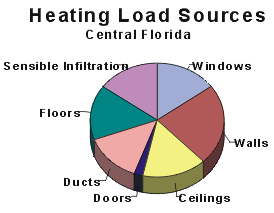
 Heating load sources in central Florida are significantly different than cooling
load sources. In addition, the pie chart shown in Figure 3 at the right is
somewhat misleading due to the fact that the entire heating load is roughly
equivalent in magnitude to only the duct loads in the cooling load pie chart
given above in Figure 2. Remember that in this example the heating load constitutes
only 7% of the total annual energy use - less than the refrigerator. This result
is in part based on the fact that the heating system is a heat pump. If the
building were heated by a strip resistance furnace, the heating portion of
the annual energy use would be much larger.
The pie chart in Figure 3 clearly shows that the home's envelope constitutes a significantly larger part of the total heating load than it does for cooling. For heating, the internal gains (which constitute a significant air conditioning load in summer but do not appear on the heating load source pie chart) are of great benefit in offsetting heating requirements. Likewise window loads constitute a much smaller part of the pie because during much of the day they offset heating requirements by admitting sunlight (heat). In fact, improving the performance of the windows in summer will likely dis-improve their performance in winter - and visa versa. This last point is important because achieving a balance between winter and summer performance is always a critical consideration of building energy efficiency. For this reason it is important not to over-generalize, because as pointed out in Figure 1 above the relationship between the heating and cooling energy uses in Florida buildings is a strong function of location, with buildings in north Florida having a much more significant heating load (~15% of total energy use) than those in south Florida (~2% of total energy use).
Florida's ENERGYGAUGE software tools provide the above information and much more on a home-by-home basis.
___________________
Footnotes:
1. Ventilation for Indoor Air Quality, ASHRAE Standard 62-89,
American Society of Heating, Refrigerating and Air Conditioning Engineers, Atlanta,
GA.
2. Cummings, J., J. Tooley and Neil Moyer, 1991. "Investigation of Air Distribution Systems Leakage and Its Impact in Central Florida Homes," Report #FSEC-CR-397-91, Florida Solar Energy Center, Cocoa, FL.
